

Bullish reversals, more clarity on leading sectors / stocks
Bullish reversals, more clarity on leading sectors / stocks

Hello everyone,
I like market-moving events because 1) the market can continue trending / start new trends after the event risk has passed, and 2) the wheat is separated from the chaff - i.e. leading sectors / stocks / assets stand out from the rest, especially if we get an initial sell-off.
An initial sell-off was what we got following a stronger-than-expected US CPI number. This led to risk assets like stocks and cryptos selling off, while bond yields and the USD rose.
Thereafter, a handful of stocks and assets managed to put in bullish reversals, meaning they recouped their post-CPI losses and more. This is a constructive development, as it means that buyers are stepping in to overwhelm the sellers, and the post-event low can now be used as a level to place a stop loss.
There are a few observations I made:
Cryptos
Cryptos as a sector closed strongly.
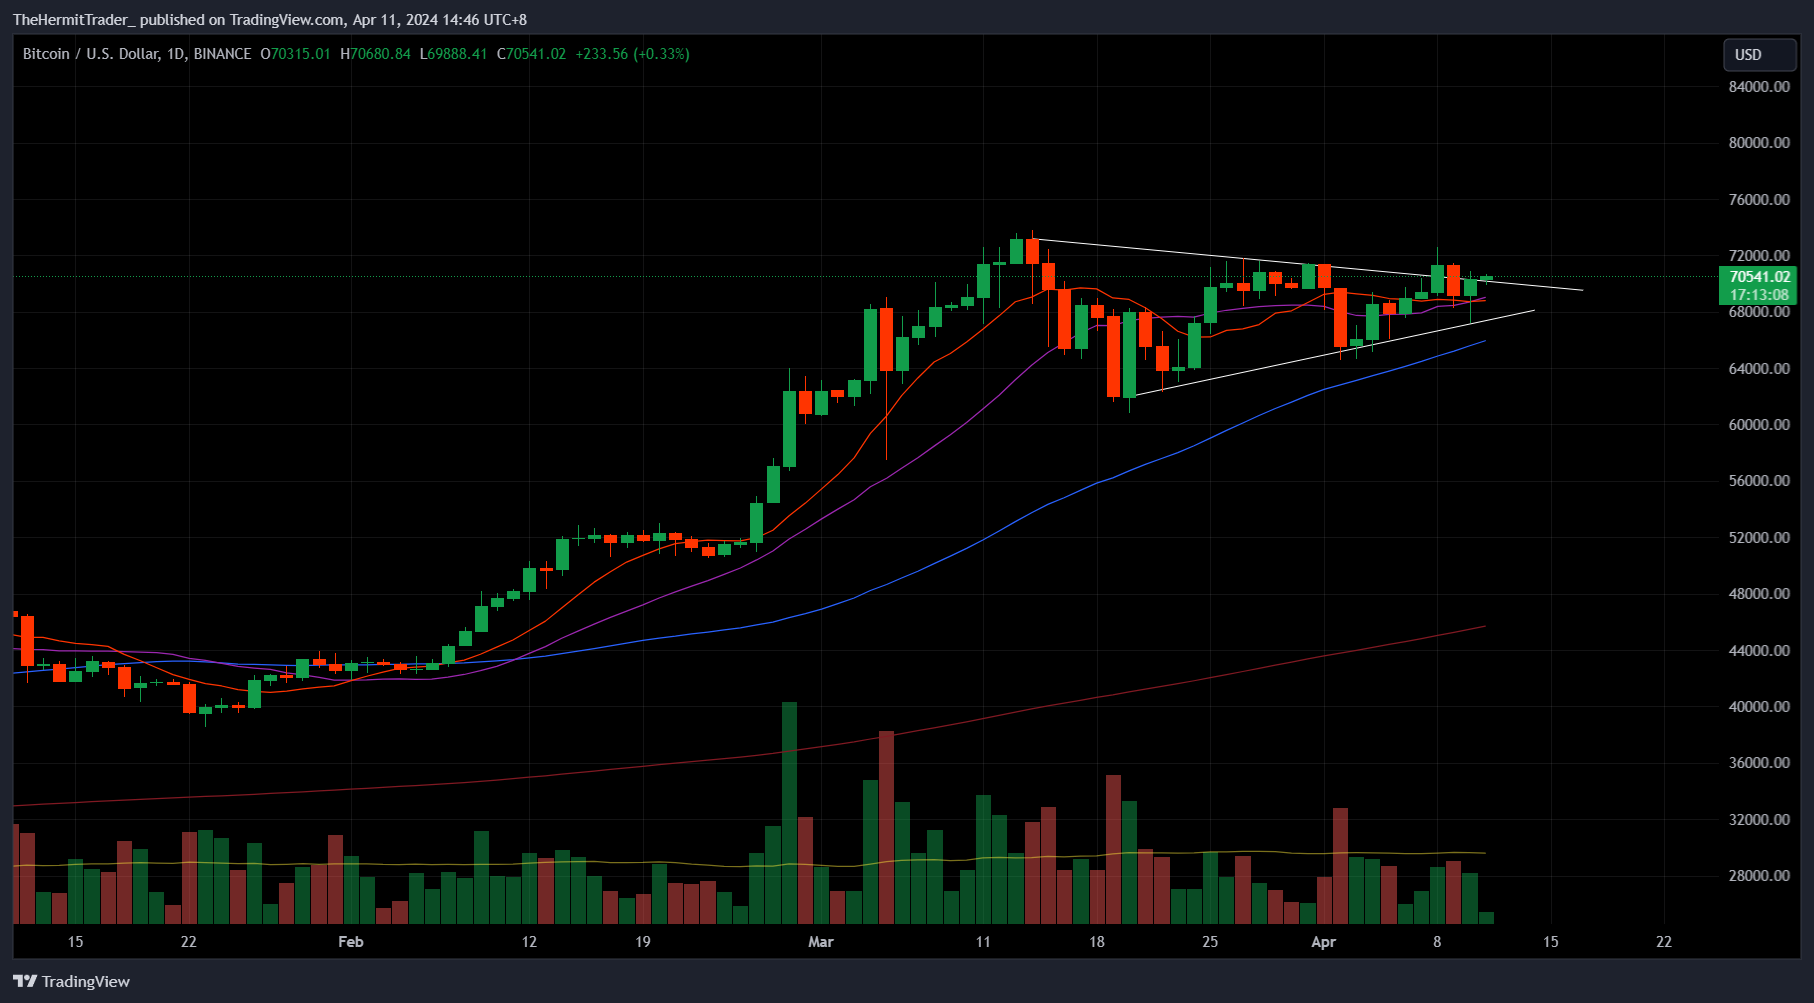
Bitcoin bounced off from the lower bound of its wedge pattern, closing green despite the initial sell-off. I am long, and am expecting it to counter-attack / breakout higher from this wedge pattern.
Daily Chart: BTC
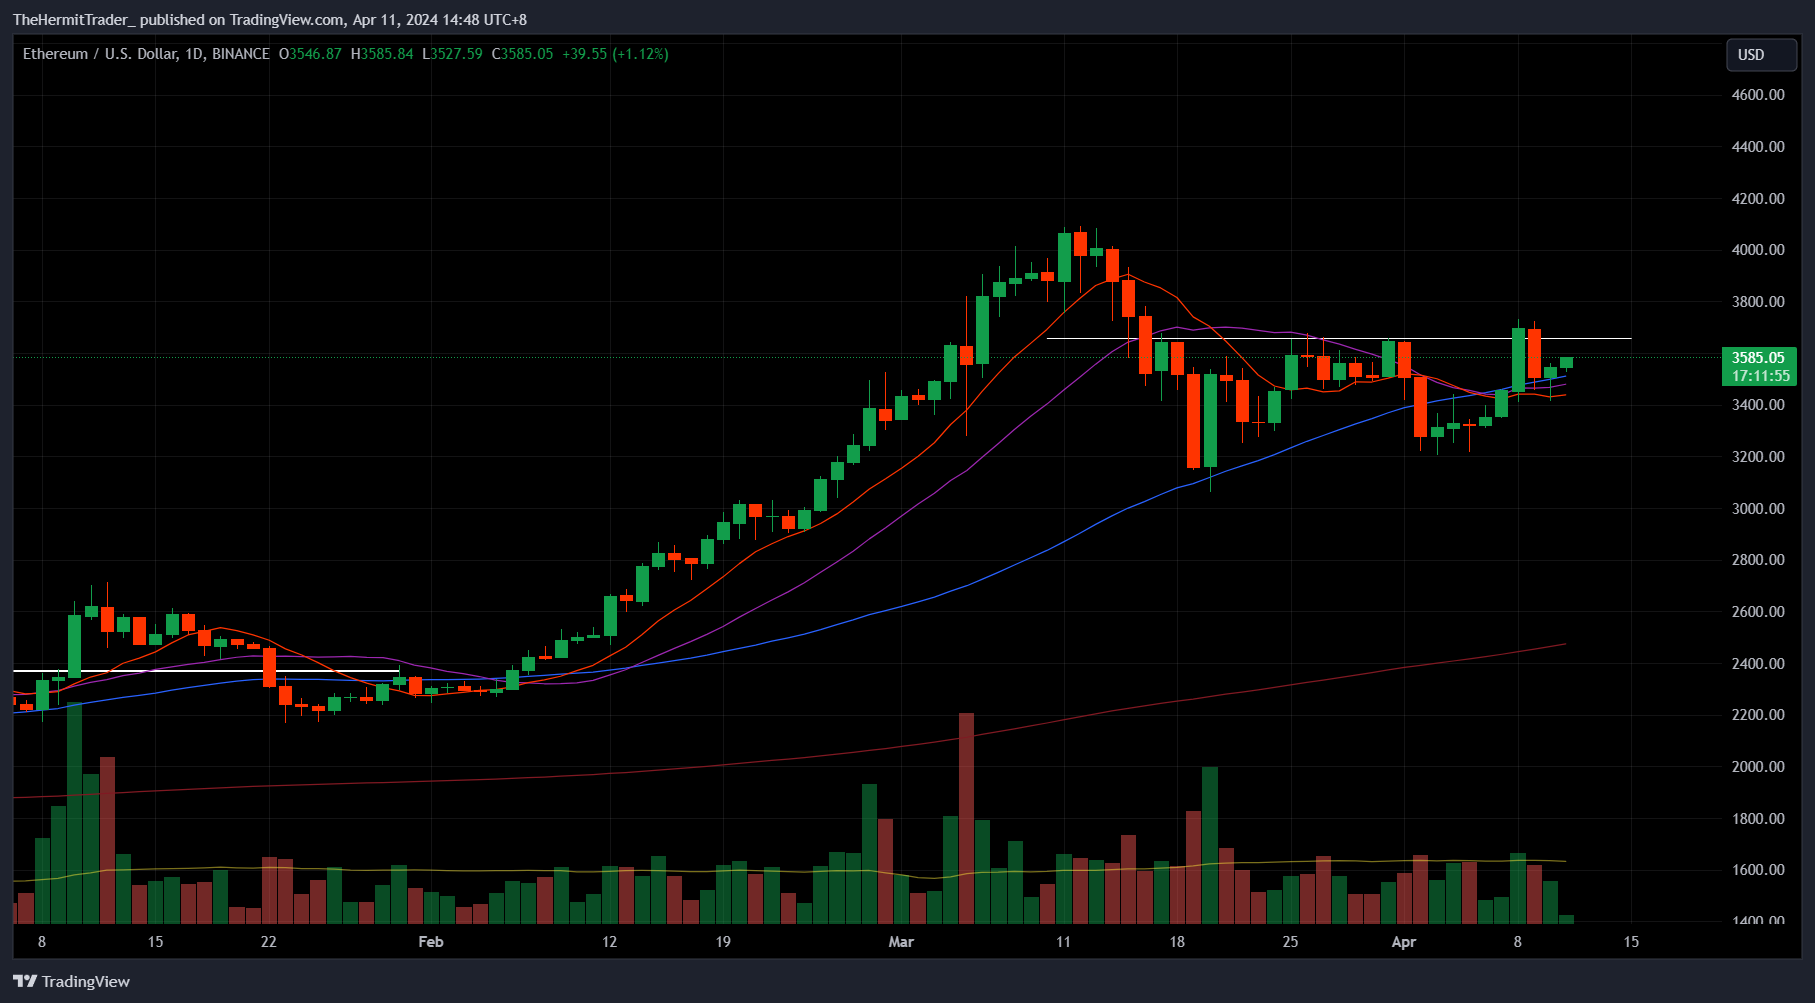
Ethereum - also put in a bullish reversal candle, bouncing off confluence of key MAs (10, 20, 50 day).
Daily Chart: ETH
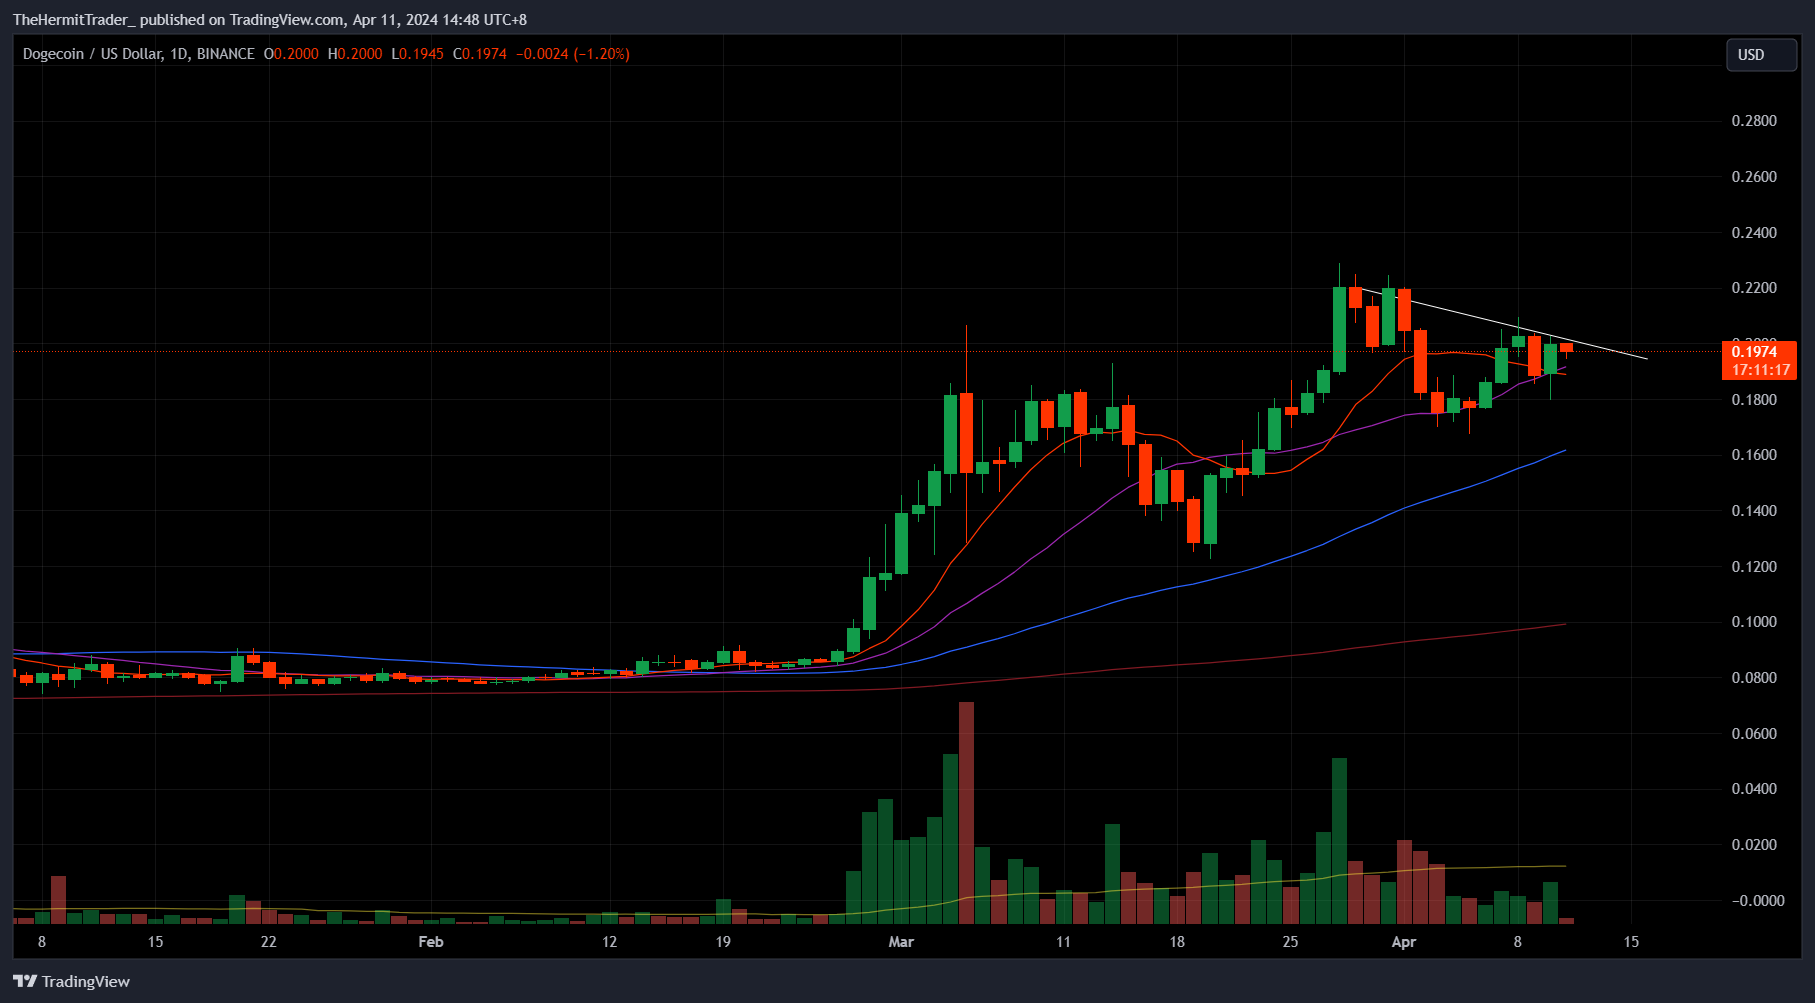
Dogecoin - After the post-CPI sell-off, I placed alerts to see which major coin would be first to erase this loss, and it was DOGE. I sent an alert to the paid chat, entering at 0.19, with a stop at 0.1788 (just below post-CPI lows). By virtue of being the first to erase the loss, DOGE has strong potential to lead the sector. Trade is now up about +1R, with spot at 0.1975. Have trimmed 50% of the position.
Daily Chart: DOGE
If we look at a couple of ratios of Bitcoin vs X asset class, then we can see that cryptos have been consolidating against other asset classes for a few weeks now, and could breakout soon.
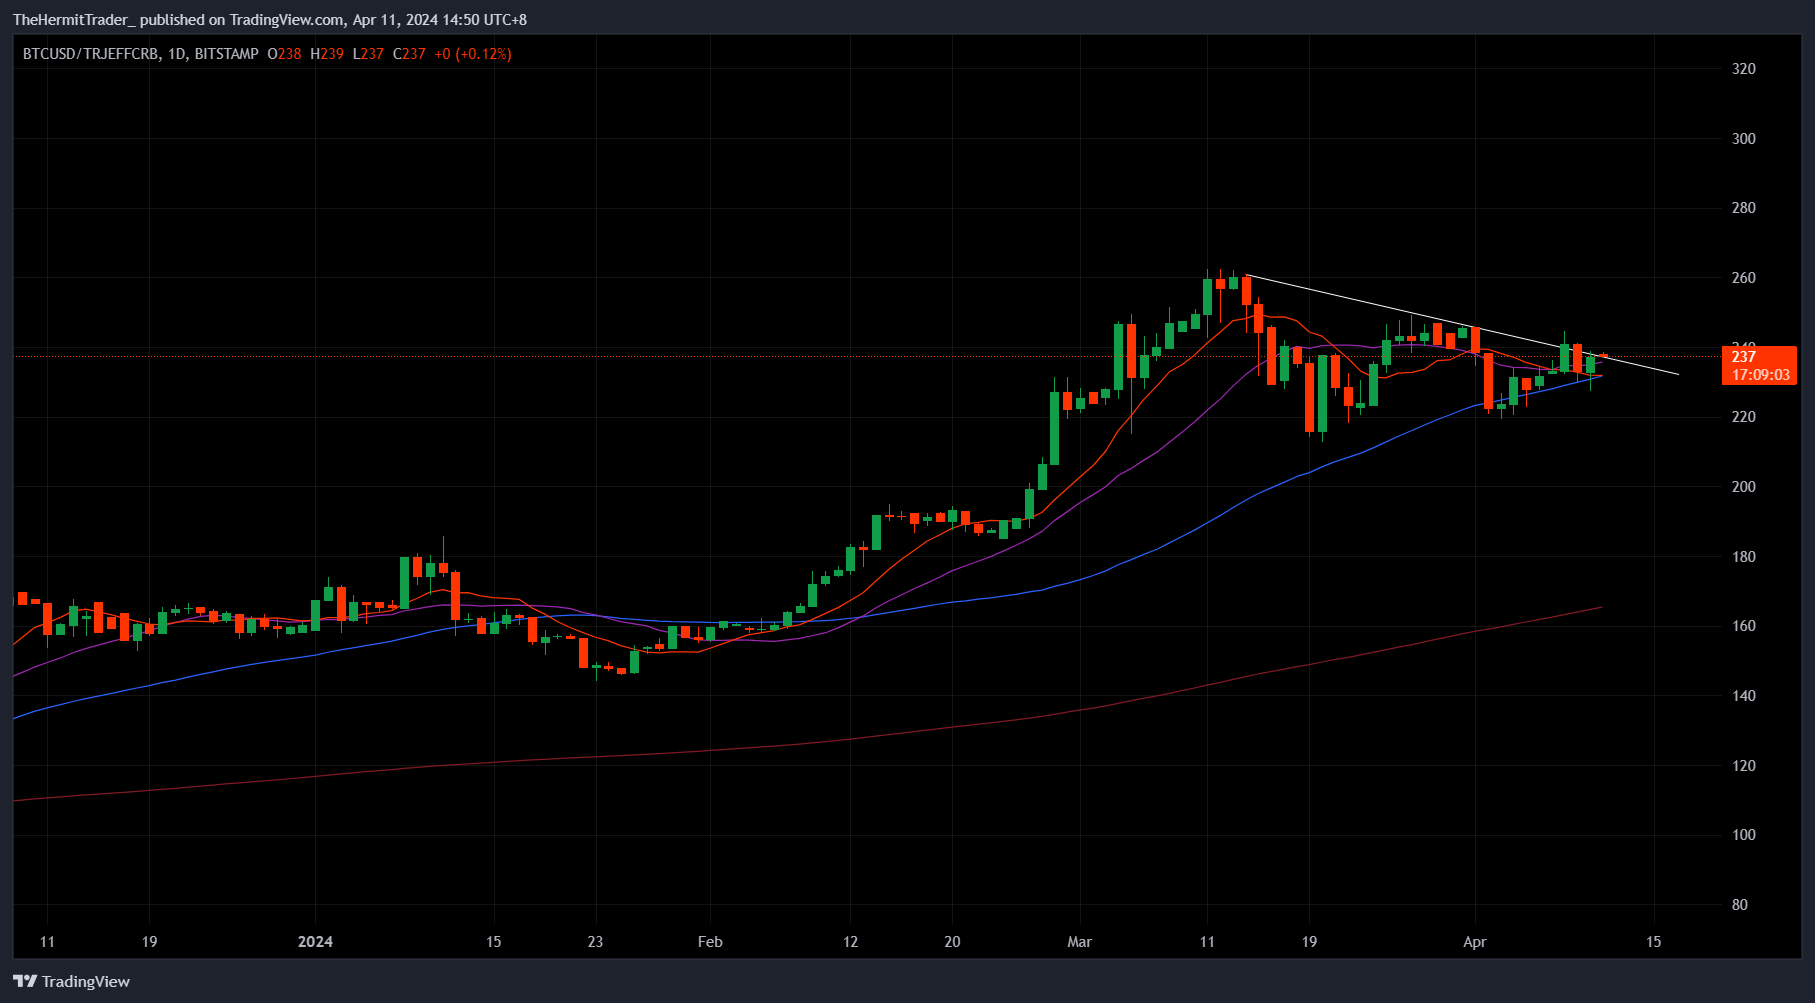
BTC vs commodities - testing upper bound of wedge pattern.
Daily Chart: Ratio of BTC vs Commodities
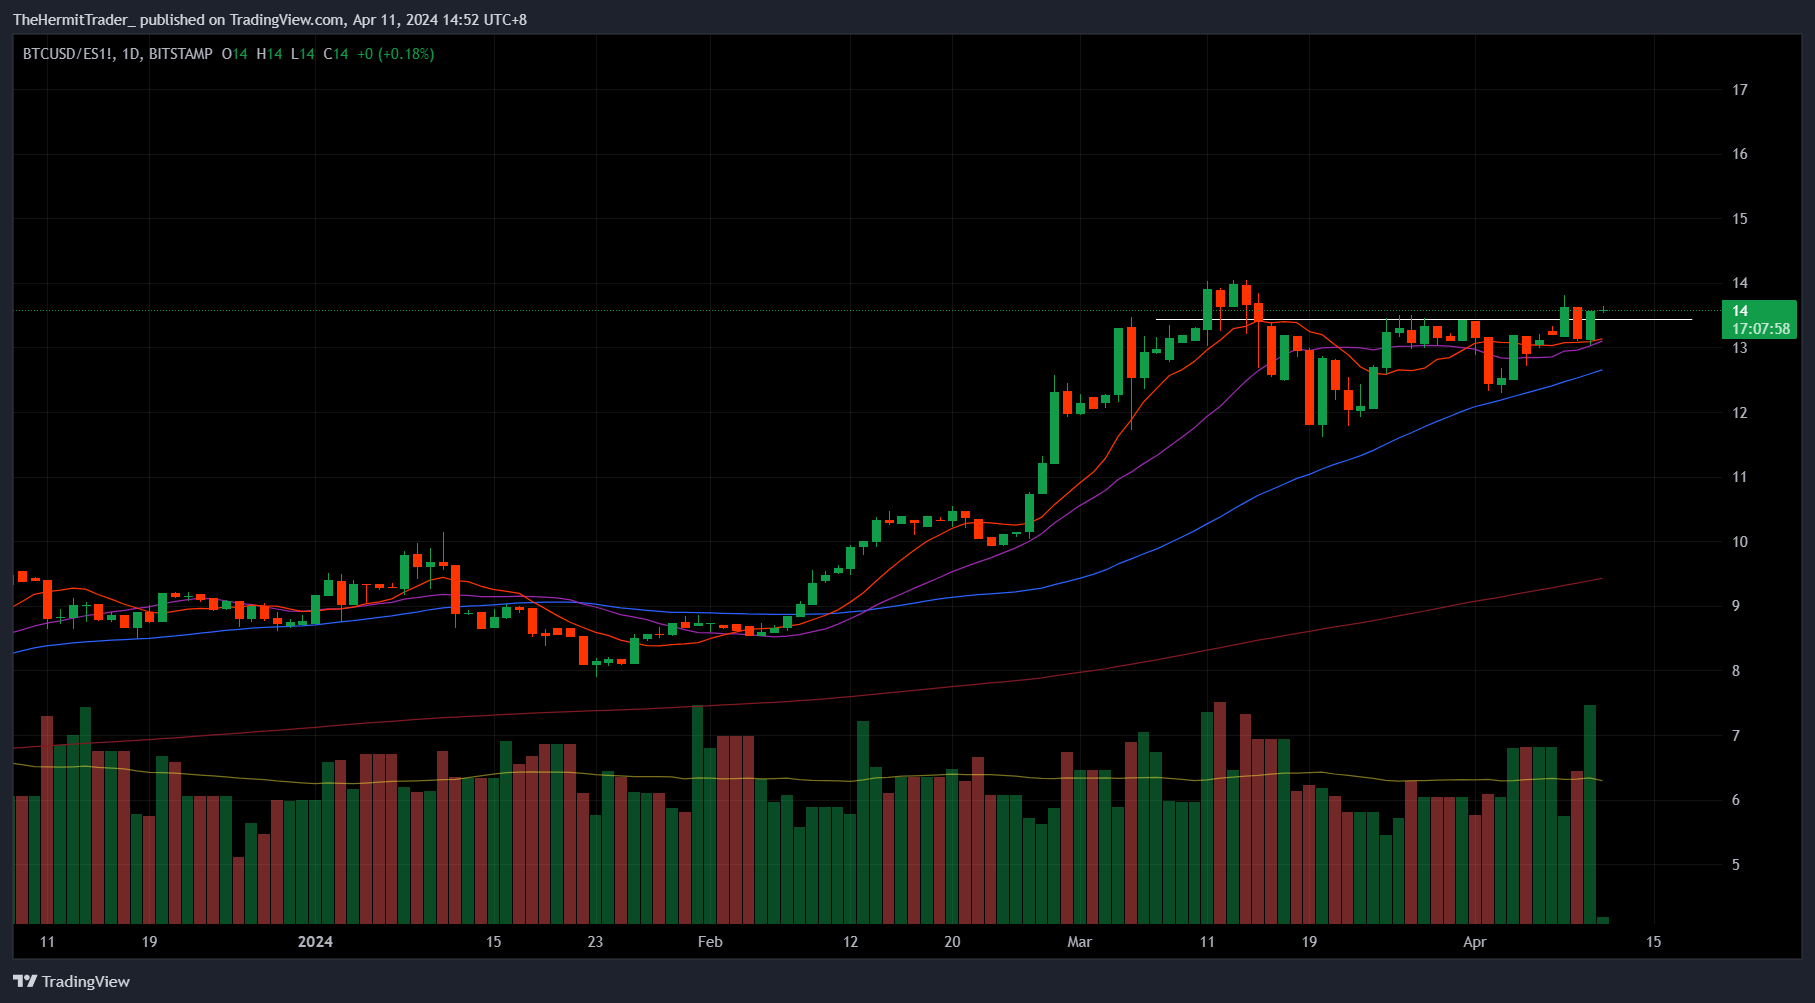
BTC vs S&P 500 futures - out from mini W-shaped consolidative pattern.
Daily Chart: Ratio of BTC vs S&P 500 futures
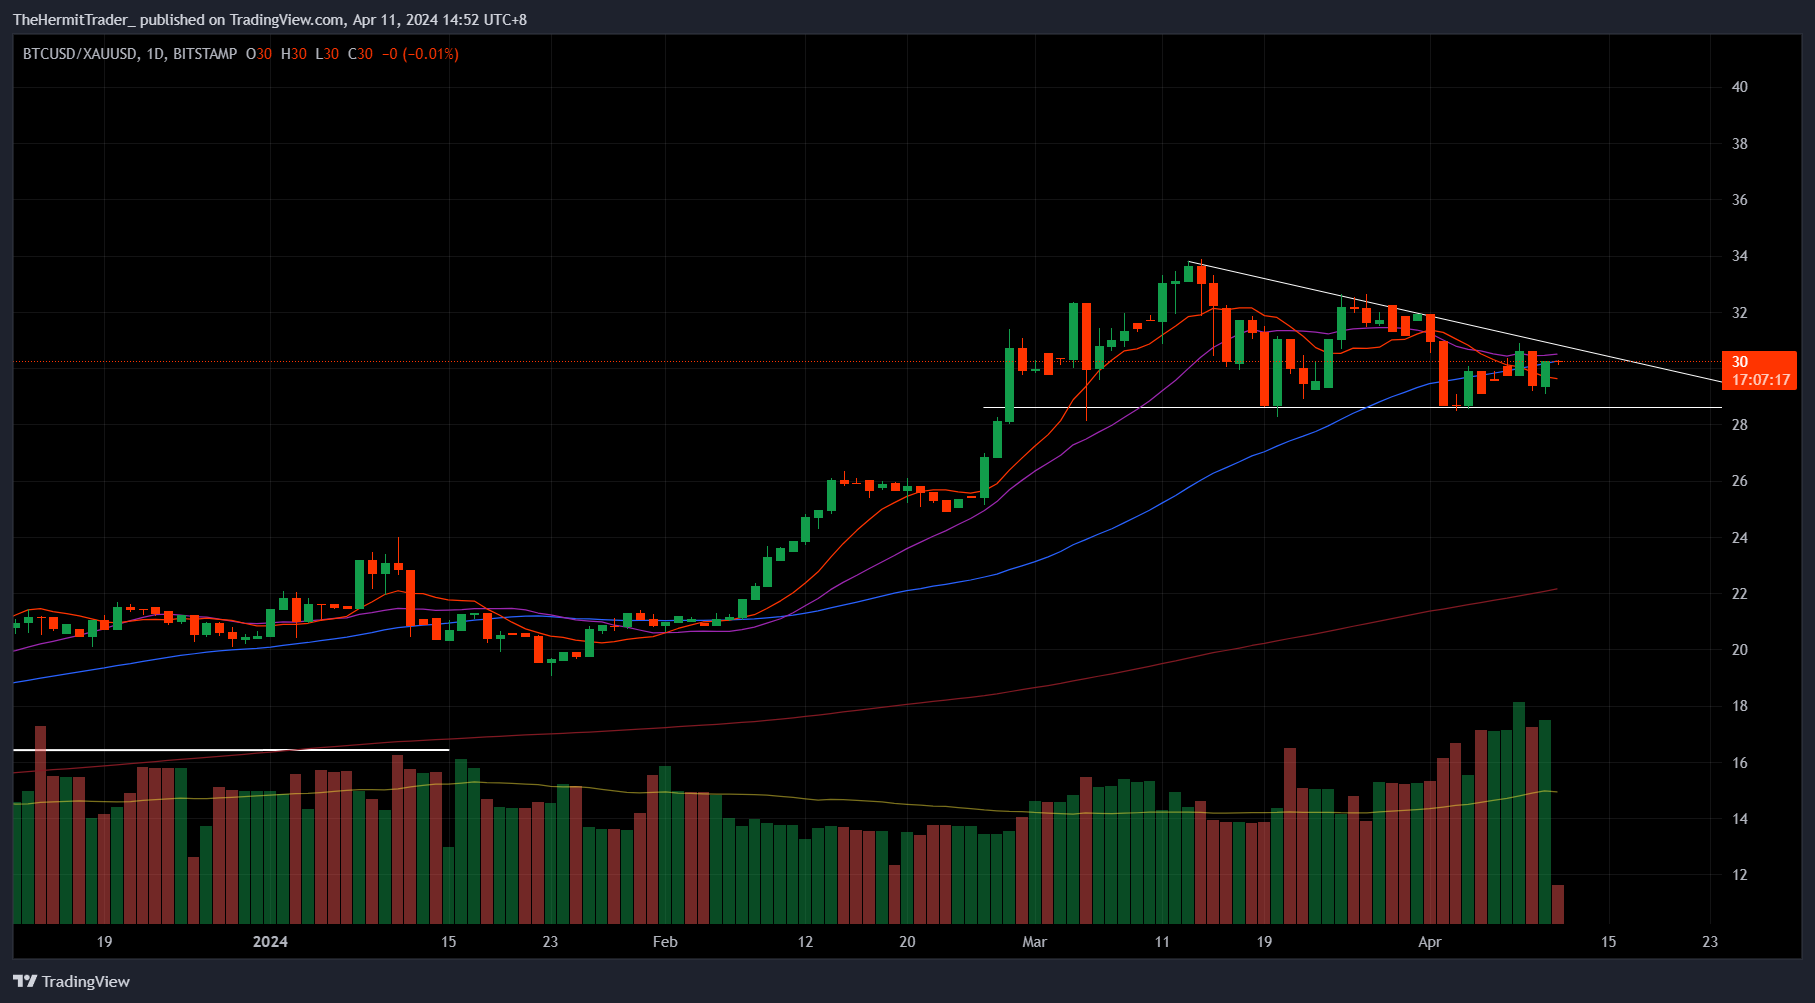
Ratio of BTC vs gold - still within wedge, but closed strong on Wednesday.
Daily Chart: Ratio of BTC vs Gold
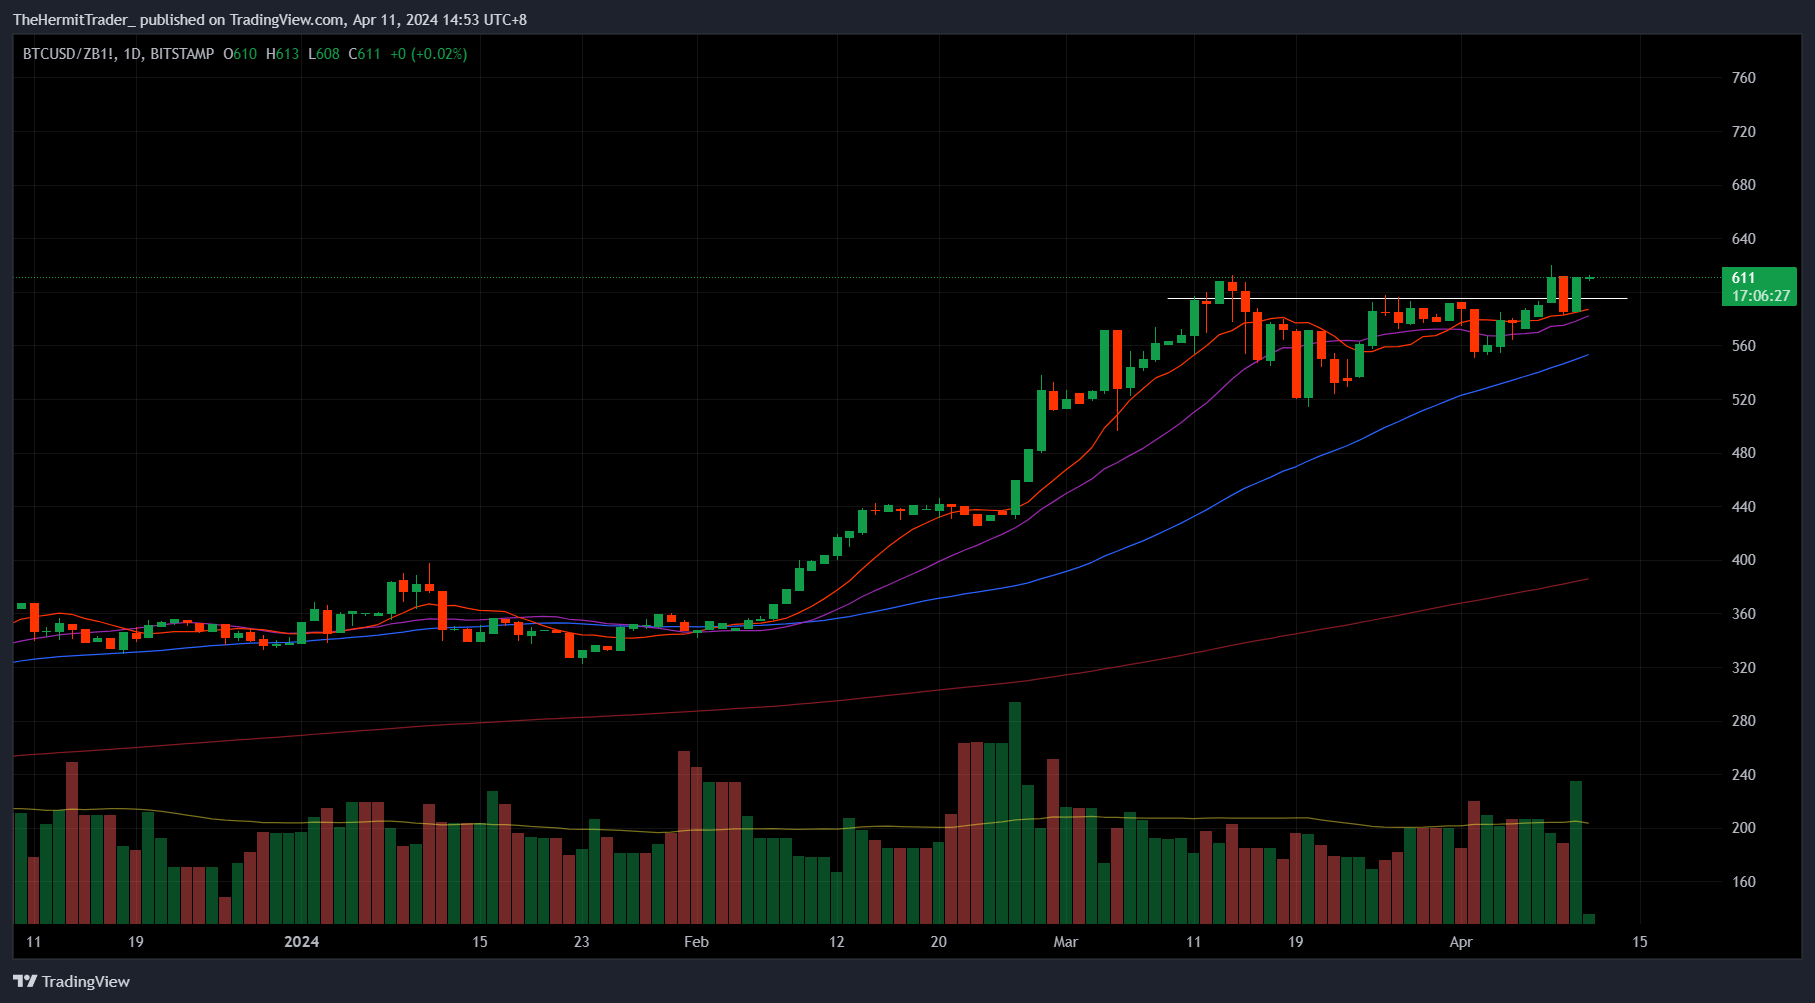
BTC breaking out against Treasury bonds after few weeks of consolidation.
Daily Chart: Ratio of BTC vs Treasury bonds
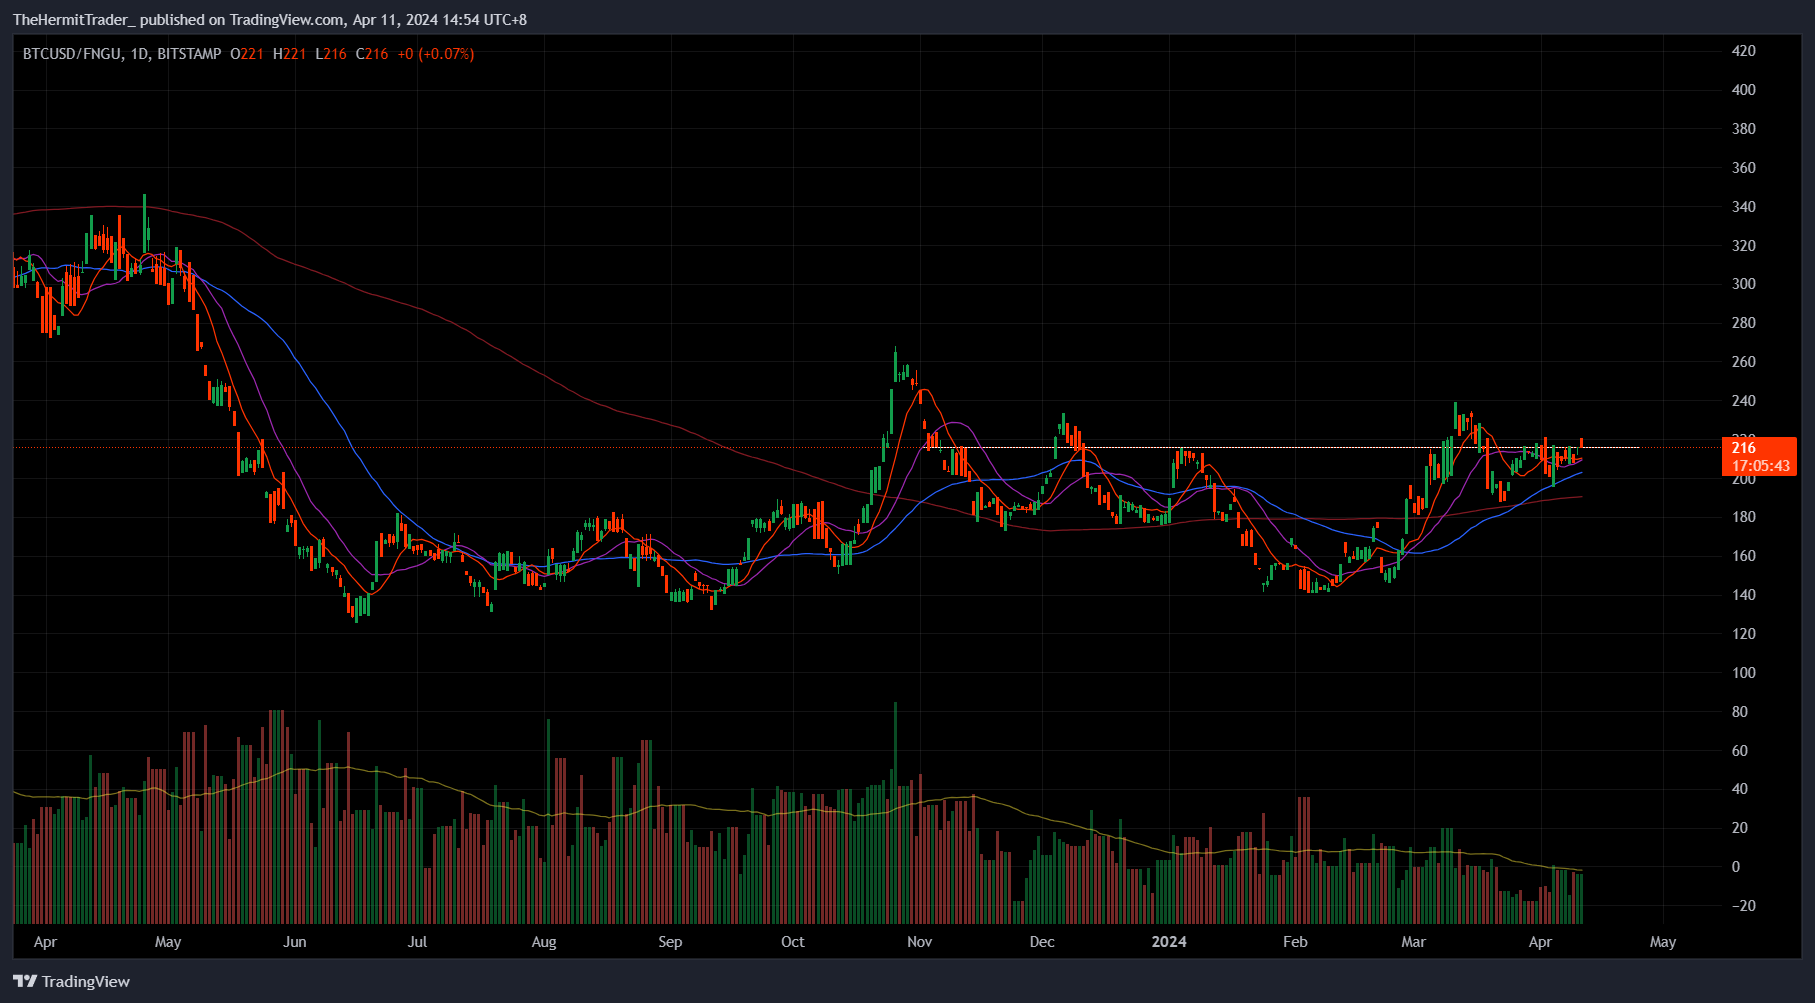
Hard to outperform FAANG stocks, but BTC is testing key breakout pivot vs FNGU.
Daily Chart: Ratio of BTC vs FNGU
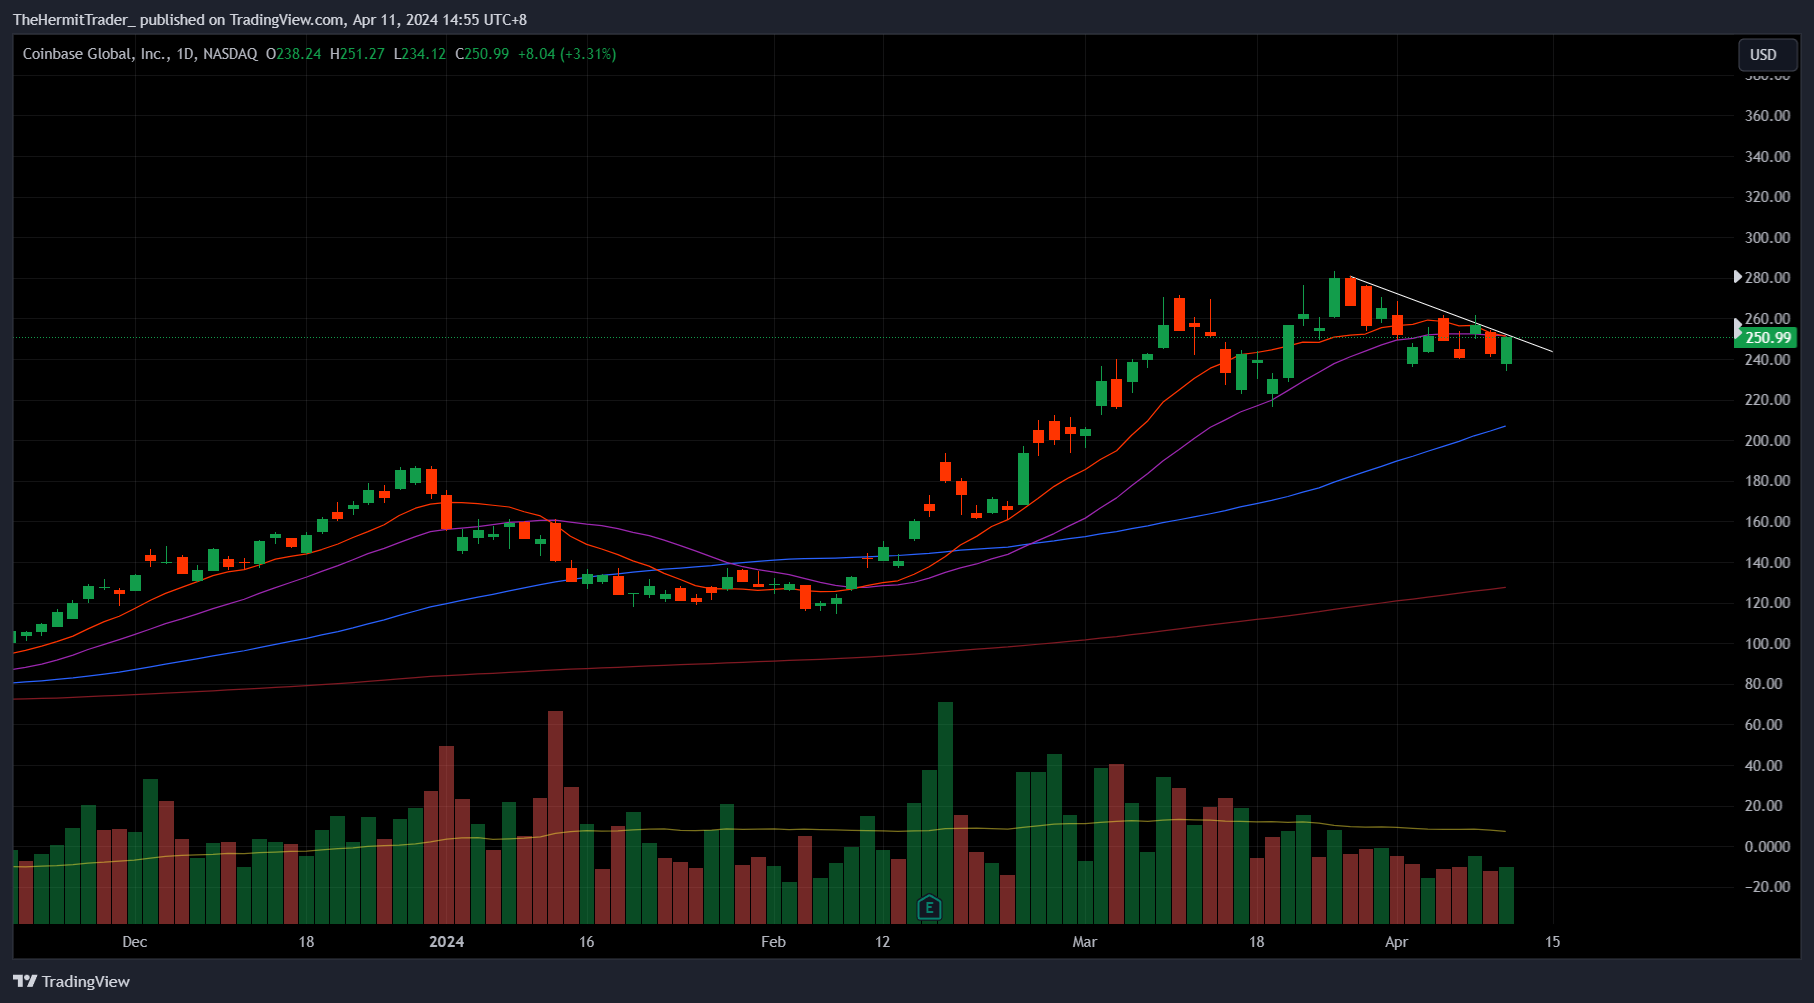
COIN - bullish reversal candle, and testing minor resistance.
Daily Chart: COIN
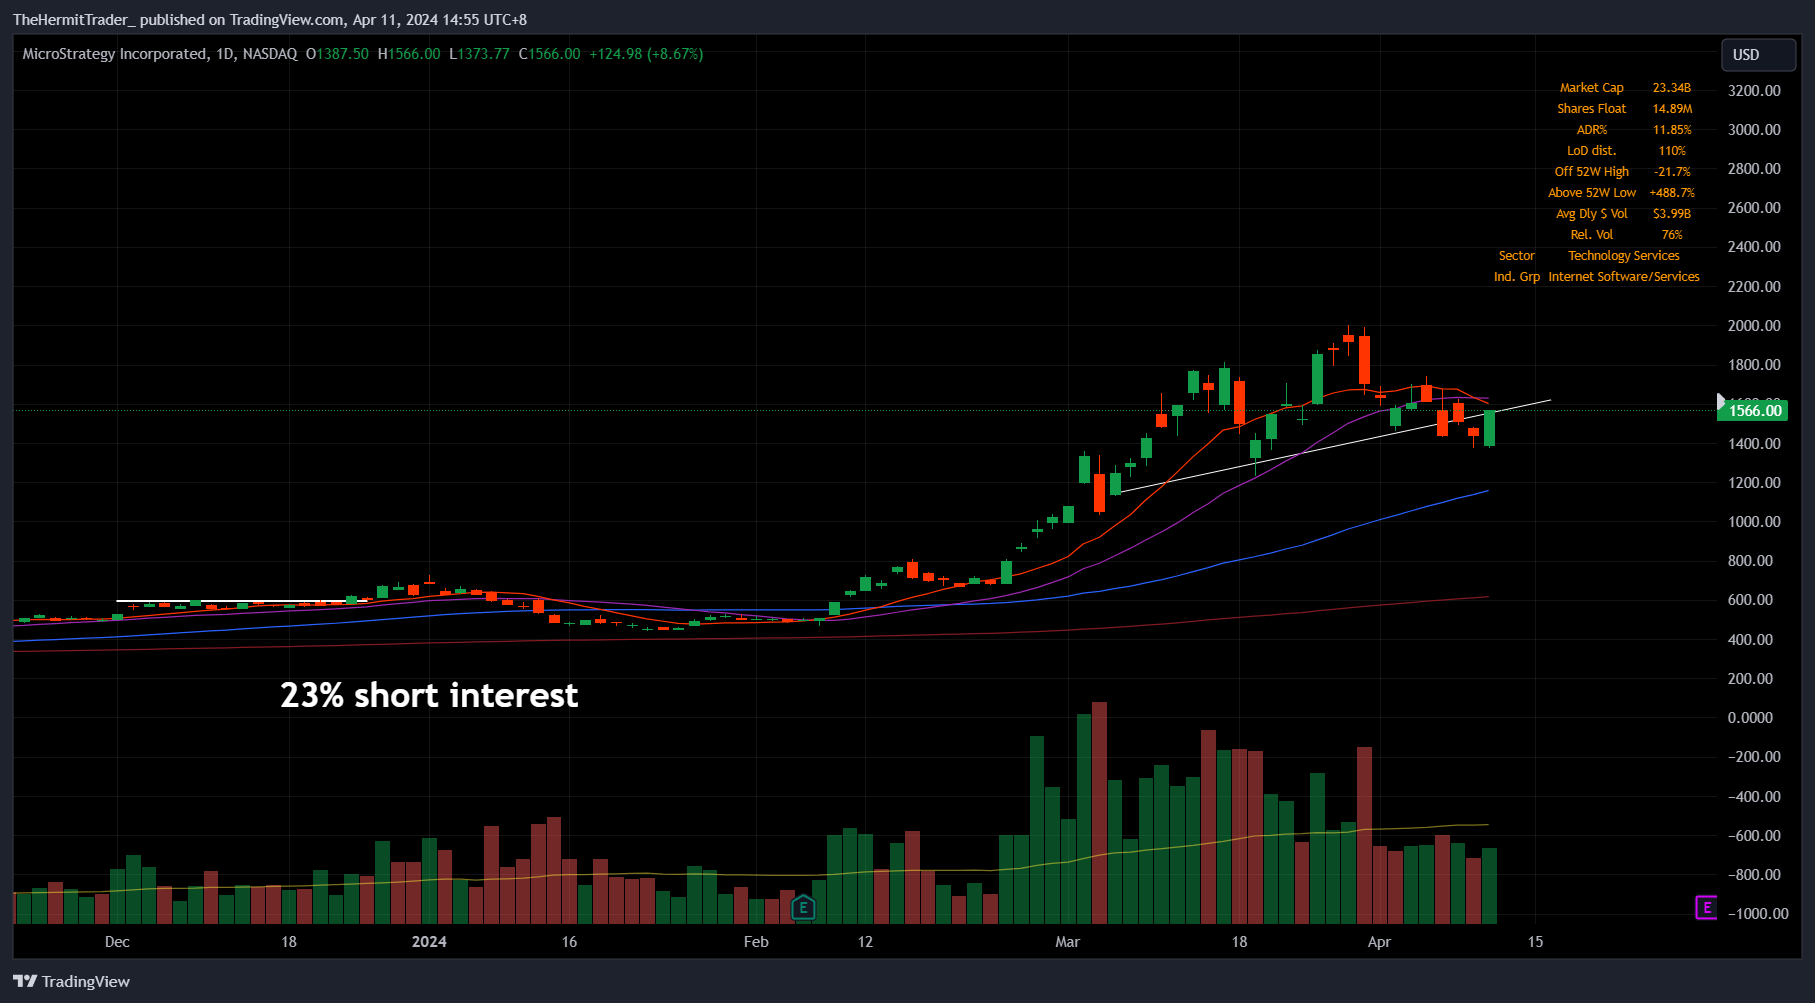
MSTR - bullish reversal candle. Stock has small float of 15m shares, and has been trading 2.5m shares on average daily, which is 17%. Stocks with small floats move faster than those with large floats, especially when demand surges. Short interest is elevated at 23% float.
Daily Chart: MSTR
Overall, I think cryptos are setting to breakout to new highs, especially Bitcoin and Ethereum. This may be achieved before the much-anticipated Bitcoin-halving event, likely to take place in mid-April.
I will be more cautious in cryptos after Bitcoin-halving is completed, as it could be a “sell the news” event, similar to back then when the Bitcoin ETF was approved.
China
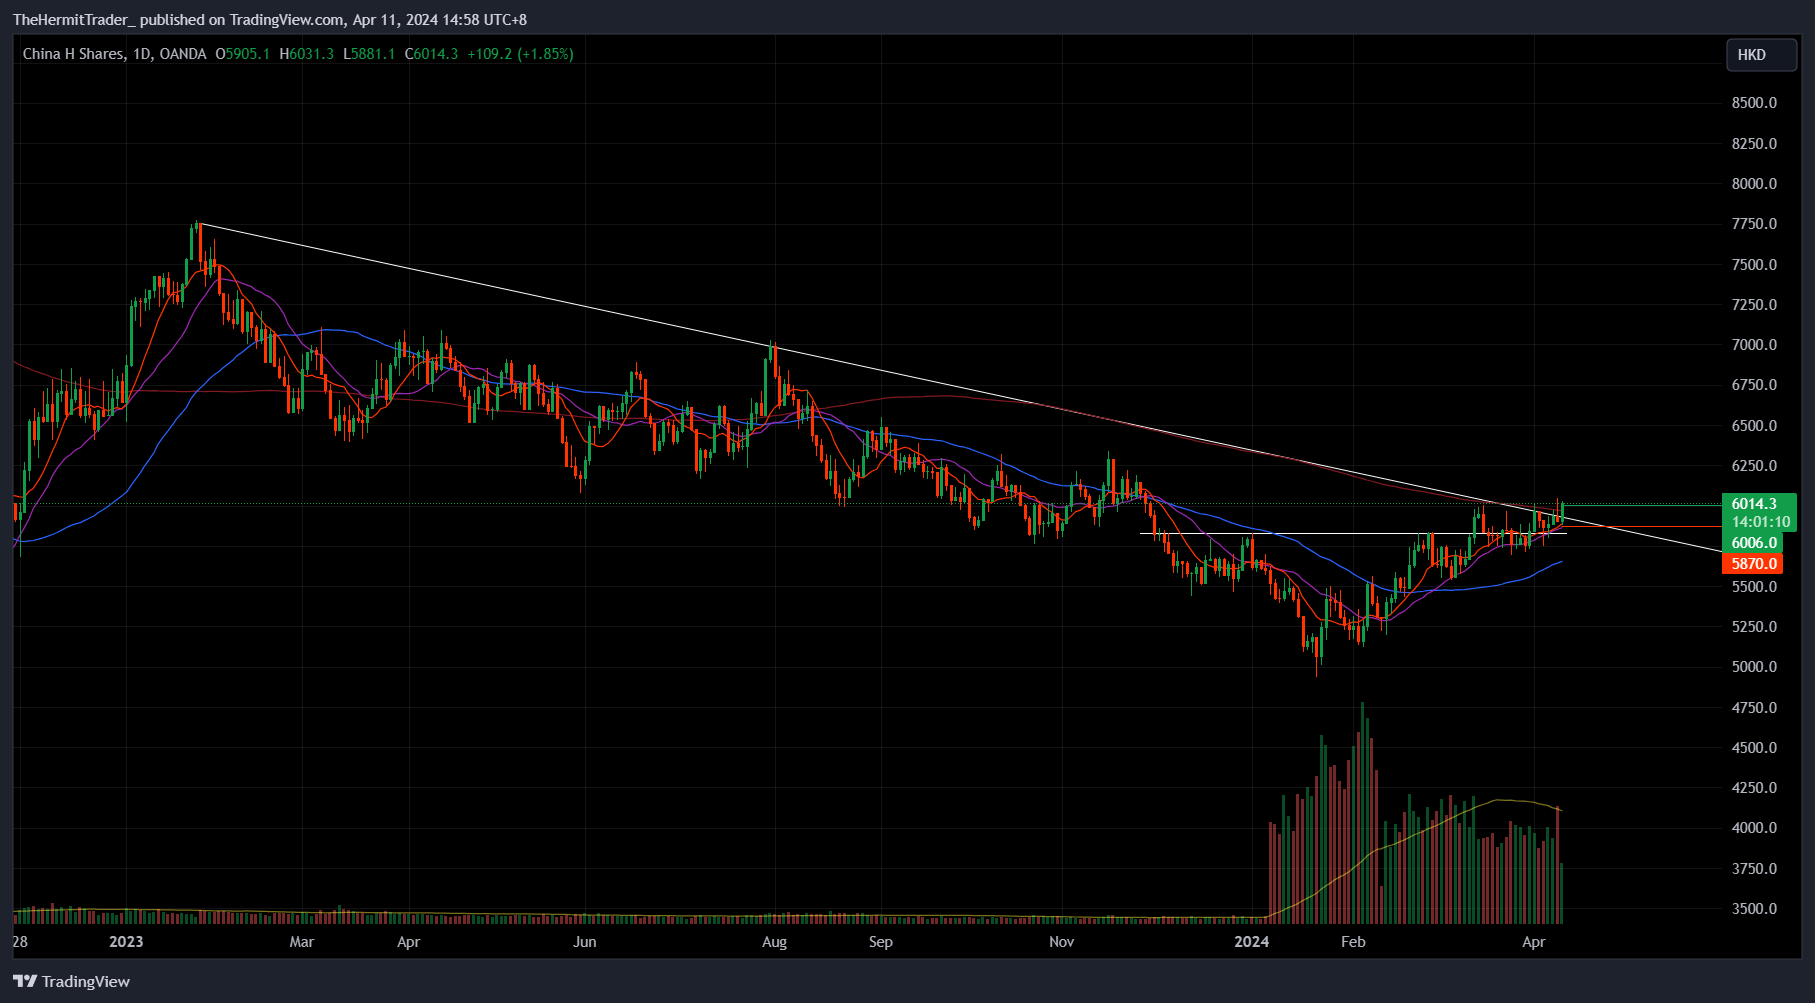
China H Shares index - the first equity index to erase Wednesday’s post-CPI losses. At a critical breakout level here. China stocks continue to show high relative strength.
Daily Chart: China H Shares
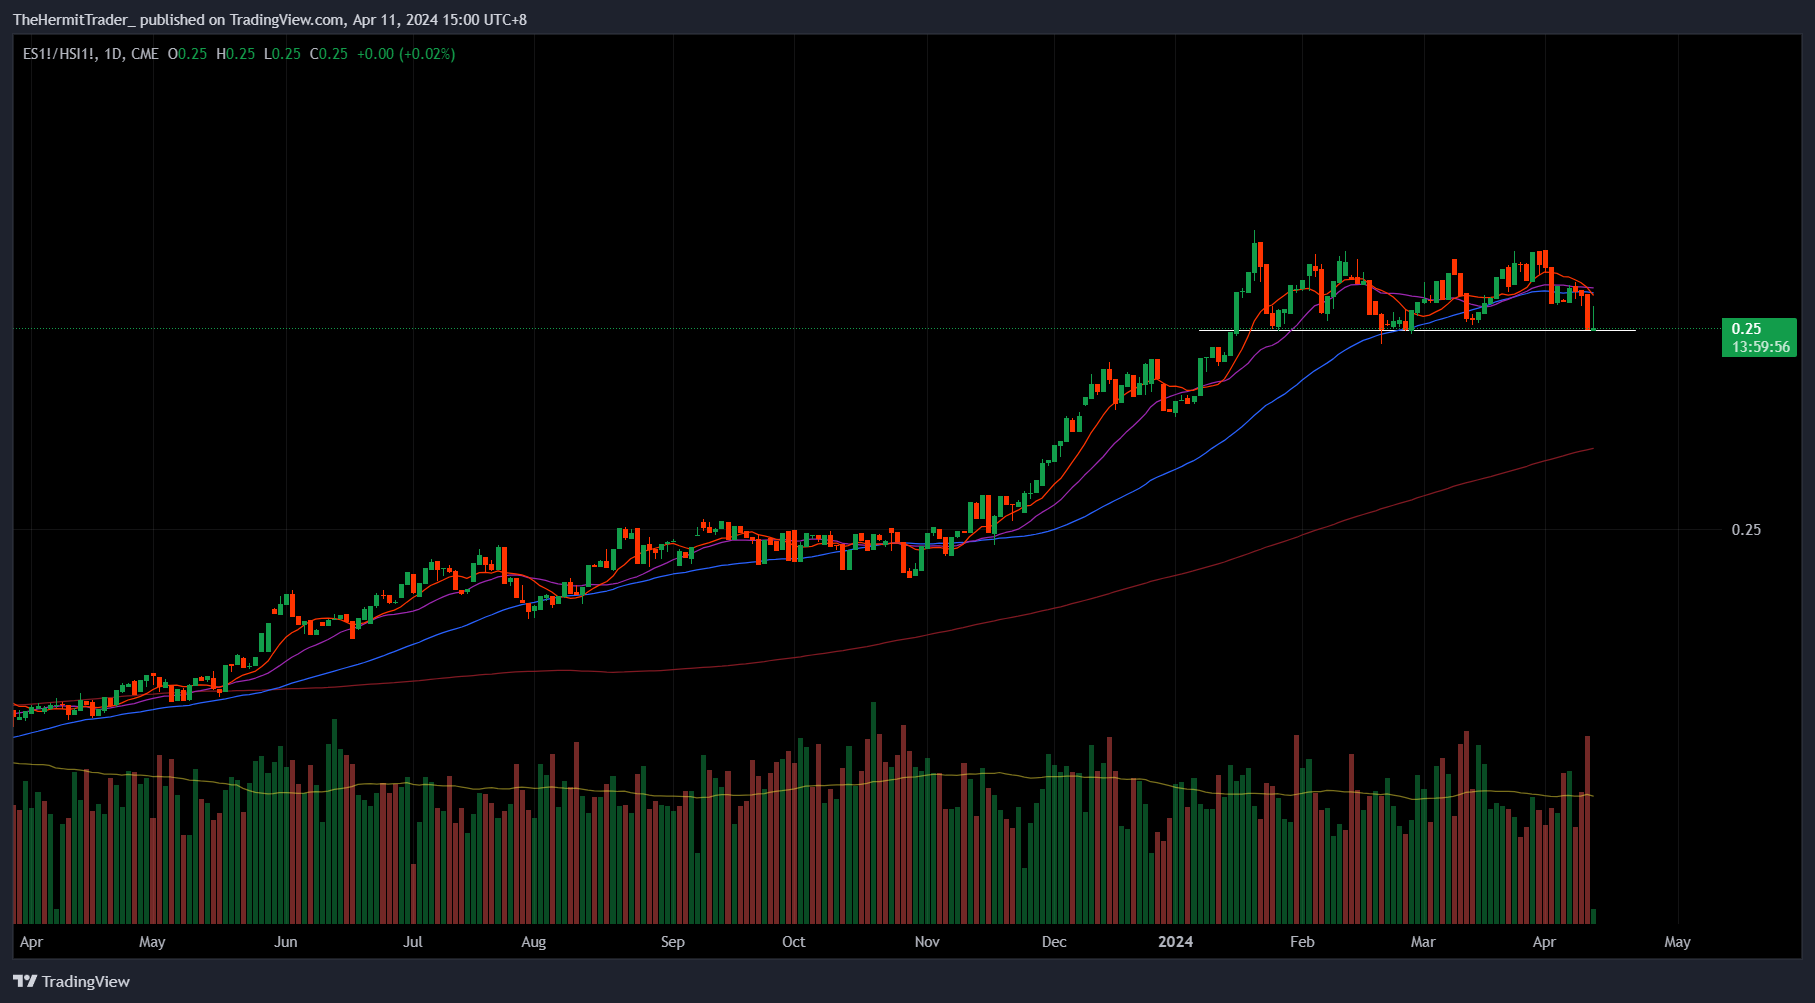
Does the ratio of S&P 500 futures vs Hang Seng index futures breakdown here, thus favouring outperformance in the latter?
Daily Chart: Ratio of S&P 500 futures vs Hang Seng index futures
Leading stocks / sectors
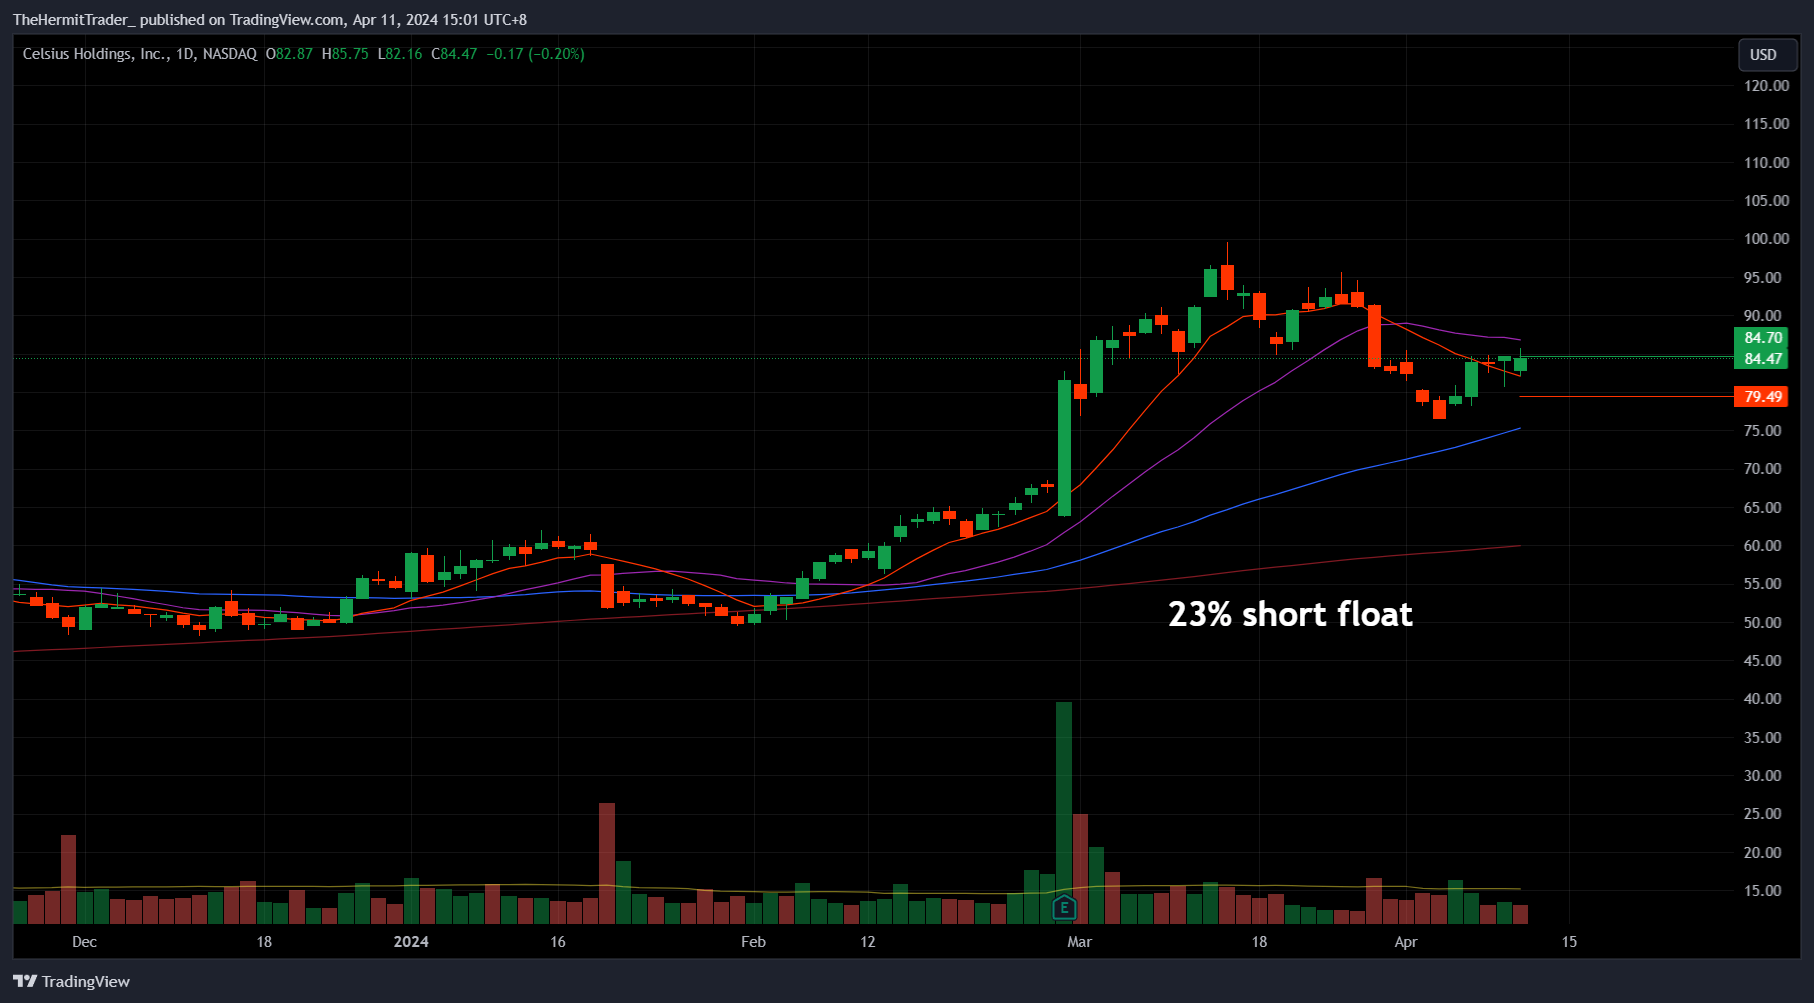
CELH - took a long in CELH on Wednesday when it erased its post-CPI losses. Last Thursday when the market was puking, CELH stayed relatively flat, before pushing +5.6% higher on Friday. On Wednesday, it was one of the first stocks to recoup post-CPI losses.
Keep reading with a 7-day free trial
Subscribe to TheHermitTrader’s Substack to keep reading this post and get 7 days of free access to the full post archives.