

Cryptos, China relative strength; Focus Setups: 9 Apr
Cryptos, China relative strength; Focus Setups: 9 Apr

Hello everyone,
Cryptos, China relative strength
Last week, I decided to play it safe after Thursday’s sharp sell-off, and to close out existing positions.
I also made a list of leaders which looked vulnerable to following through lower, as a gauge of risk sentiment.
The follow-through lower on these stocks and indices did not take place, and instead, some stocks and sectors showed grit / relative strength to push higher.
The sectors that caught my eye are cryptos and China. Consequently, I took up longs in these sectors.
Equities-wise, I went long HUYA (China) and COIN (cryptos), although I cut 1/2 in the latter for a -0.34R loss as it did not take off as quickly as I wanted. COIN closed at cost eventually, and I will just ride the remaining 1/2.
Cryptos-wise, many altcoins were down -30% or so from their 52-week highs, so the sector presented an attractive long opportunity from a risk-reward perspective. I am intrigued by the strength in Ethereum, which has lagged Bitcoin and the altcoin space.
China
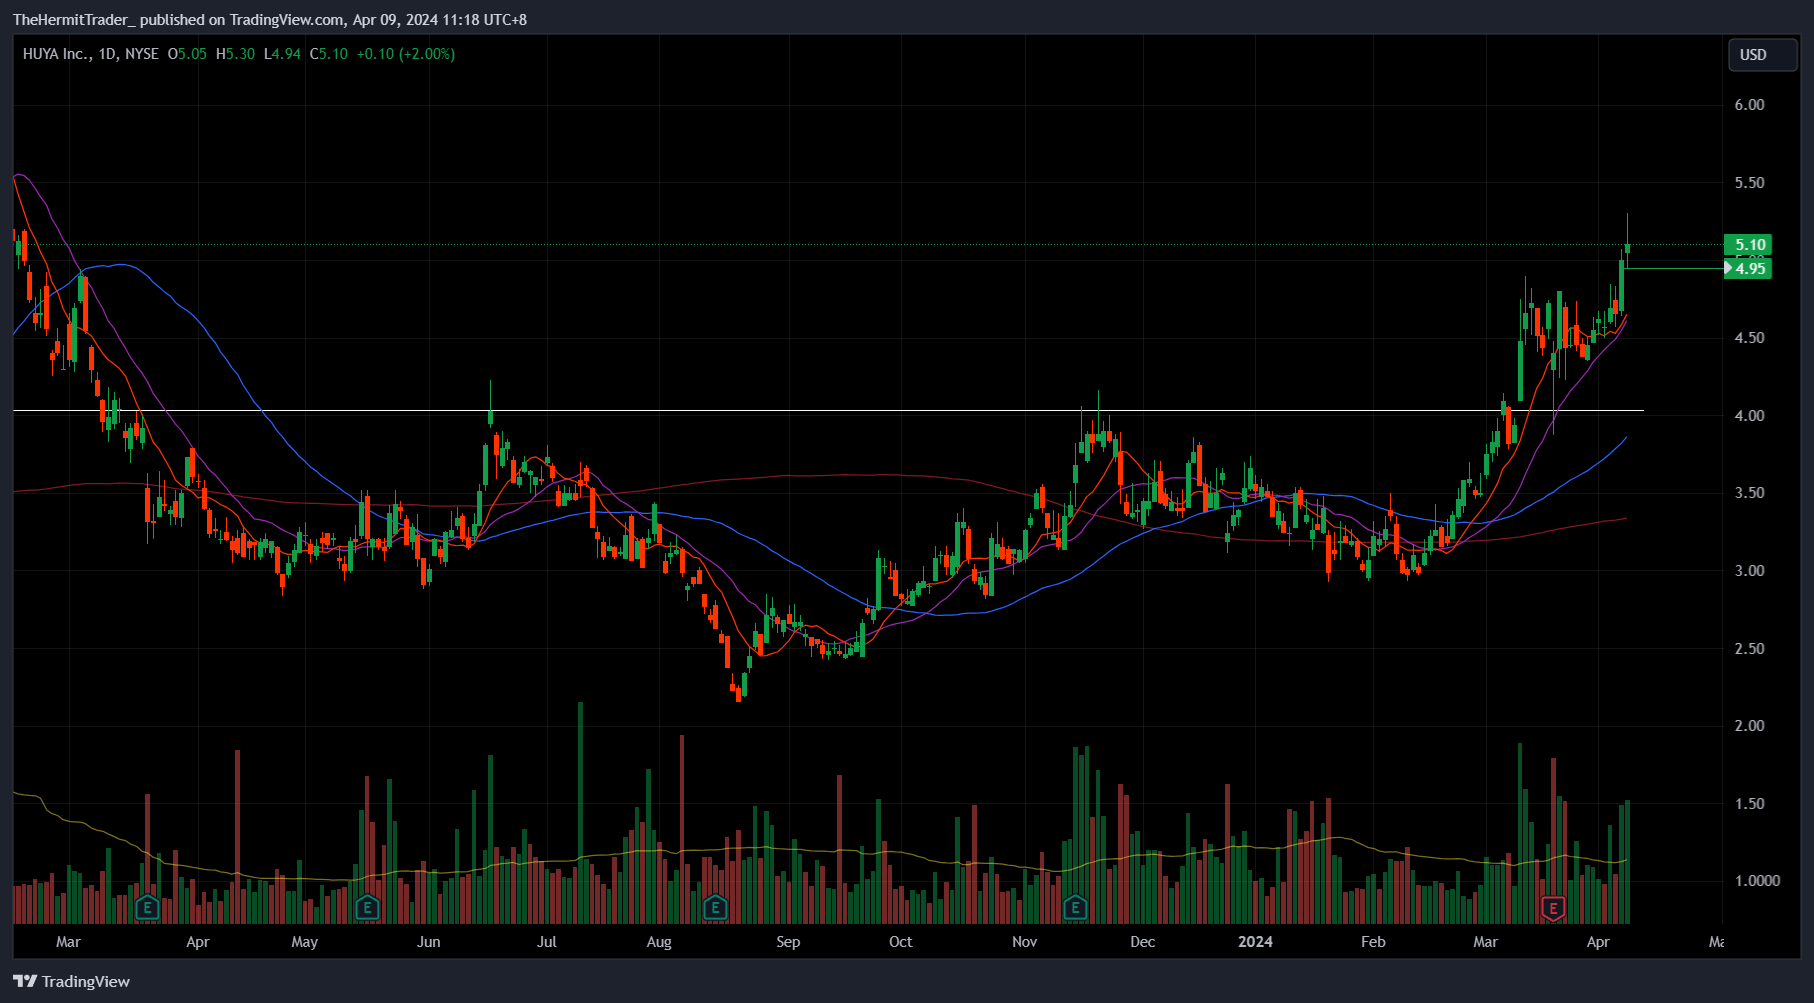
HUYA - went long on Friday, when it took out Thursday’s high. Thursday was when the sharp selling took place in the markets, so to take out the highs was notable. Stock went briefly up +1R on Monday, and I raised my stop to cost + took partial profit. Stock is out from large multi-month inverse head and shoulders base.
Daily Chart: HUYA
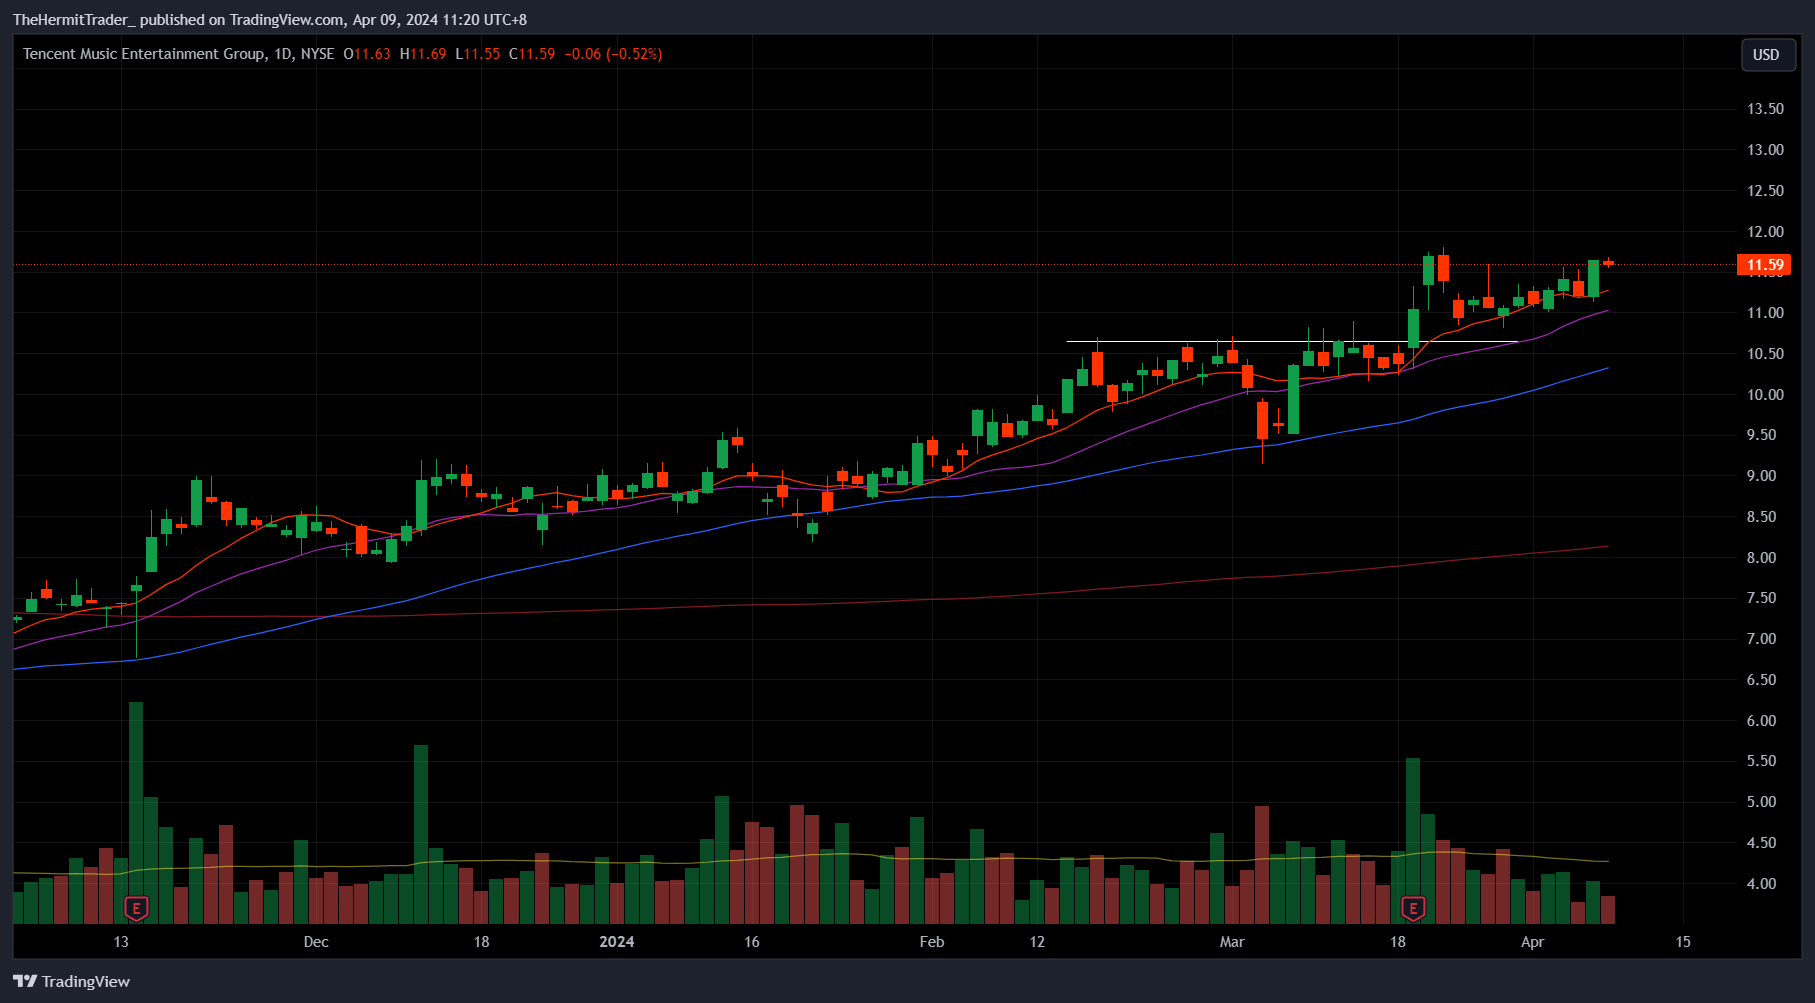
TME - clear relative strength and smooth uptrend. Took out Thursday’s high, which is important. Traded tight on Monday, which shows that the market is digesting Friday’s rally very well.
Daily Chart: TME
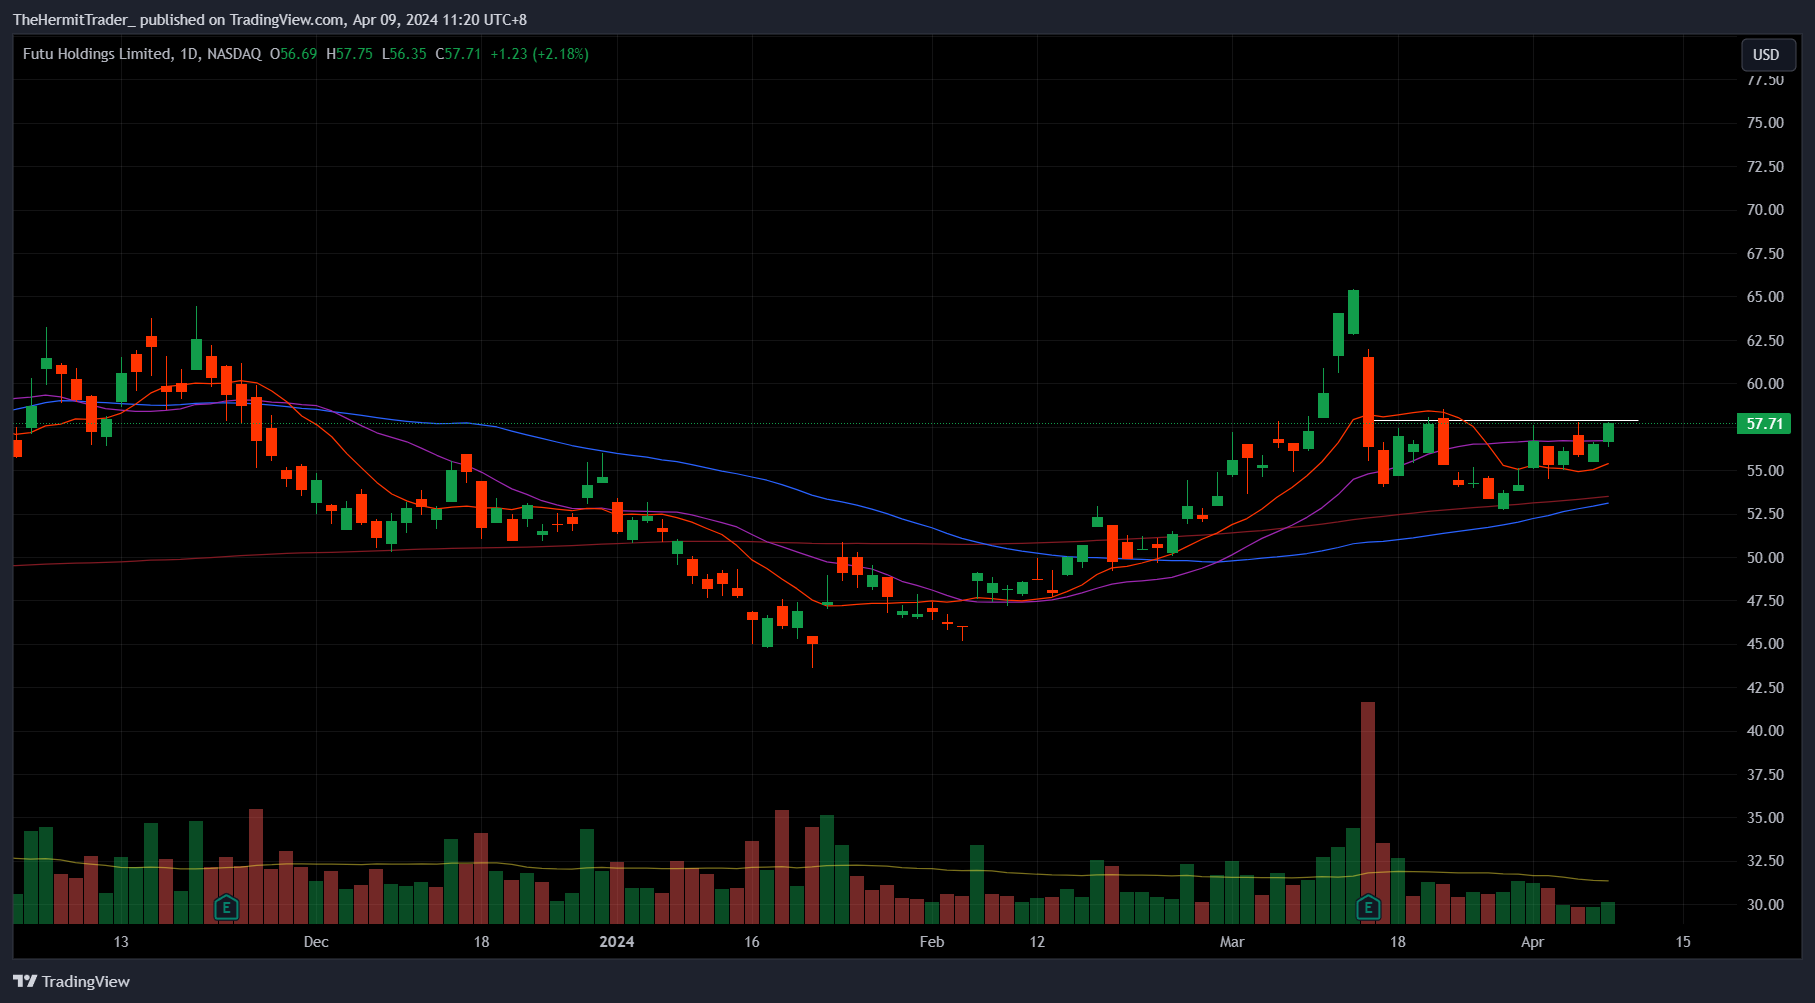
FUTU - China stocks seem to have a habit of giving up initial post-earnings gains and then consolidating, before going again. Now building a mini inverse head and shoulders consolidative base, and I am watching for a breakout today.
Daily Chart: FUTU
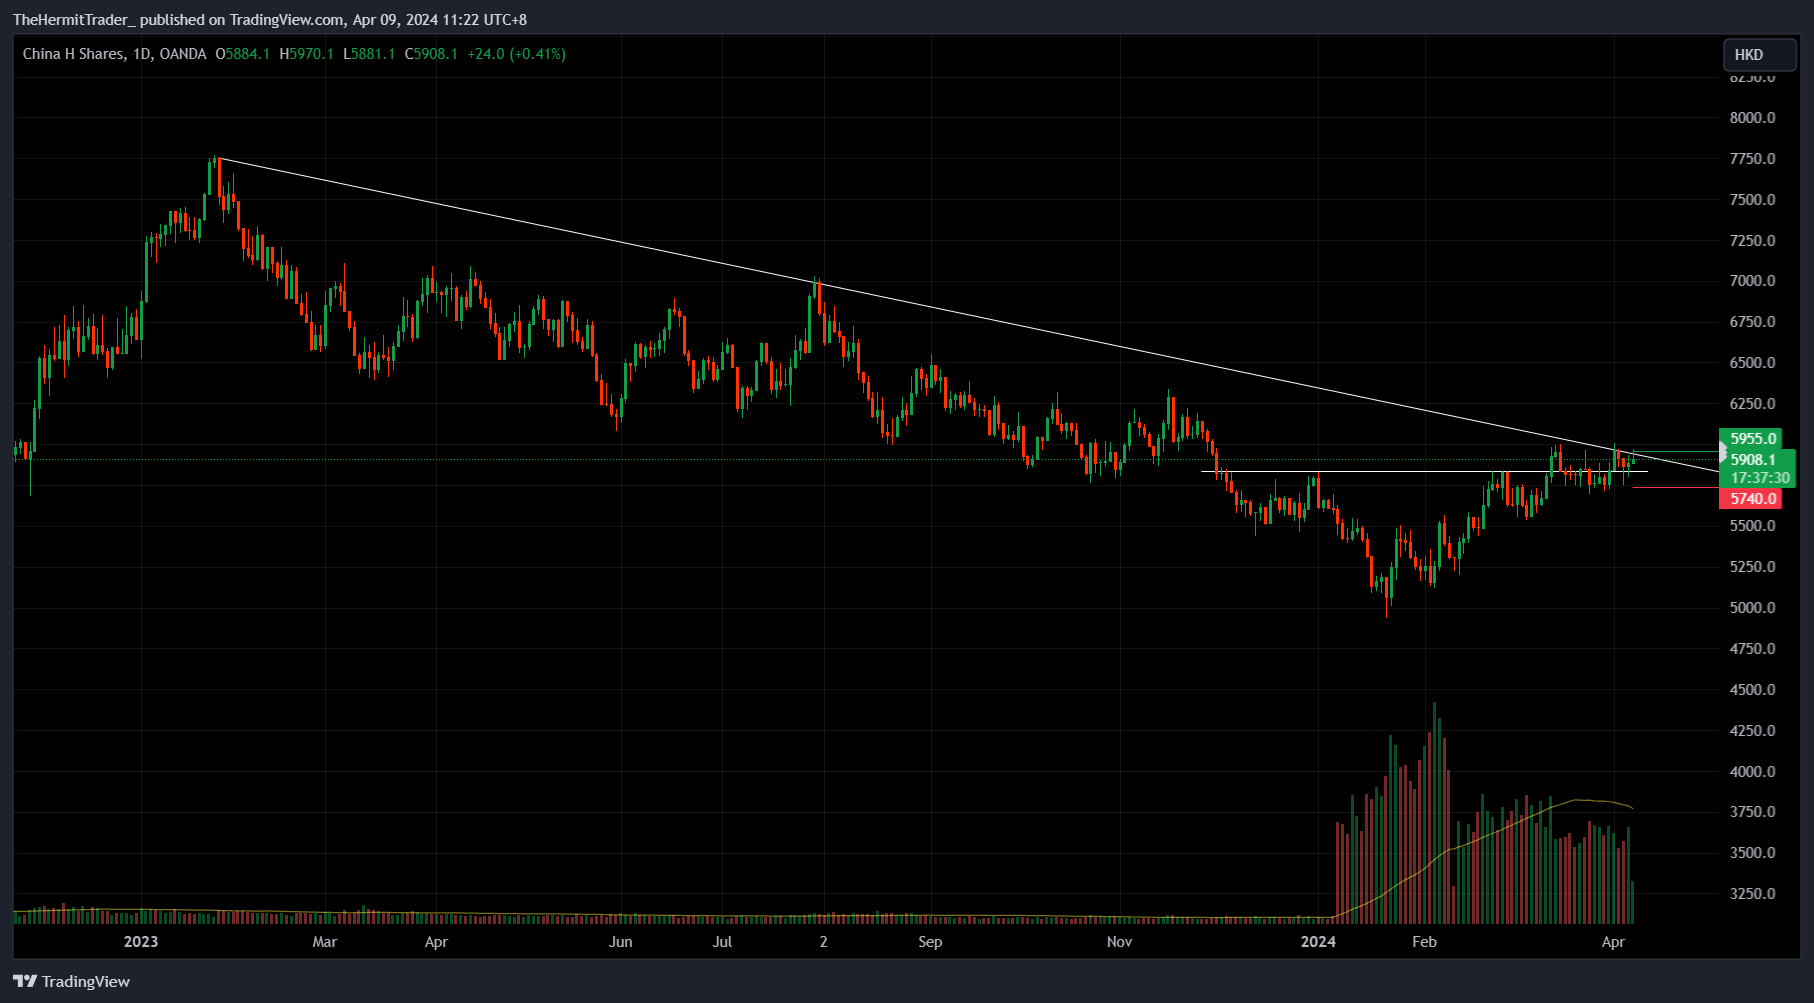
China H shares testing a big level here.
Daily Chart: China H Shares
Cryptos
Ethereum - has been lagging both Bitcoin and altcoin space, but showed relative strength in recent rally. Maybe under-the-radar, with bulls choosing other coins which have demonstrated stronger momentum in past few months. Nevertheless, ETH is now breaking out of a mini base. I went long at 3569, and have raised stops to cost.
Daily Chart: Ethereum

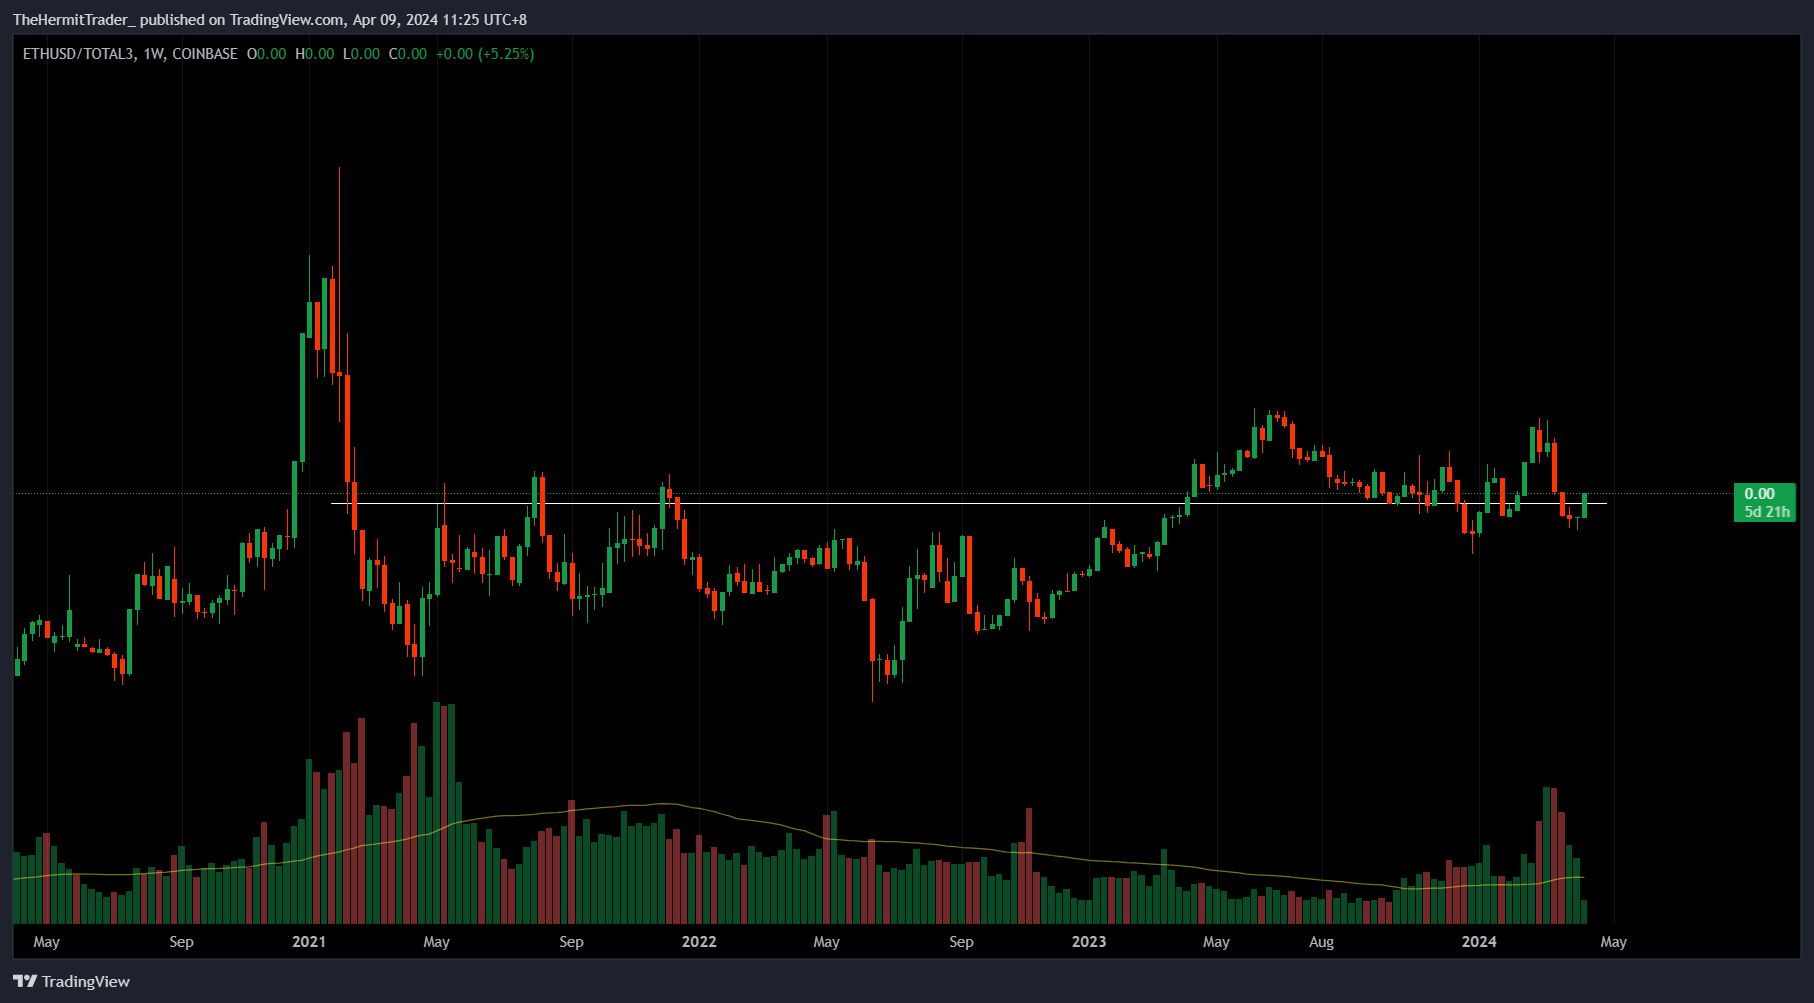
Ratio of ETH vs Crypto market cap excluding ETH and BTC bouncing at key level, showing ETH starting to outperform alts.
Weekly Chart: Ratio of ETH vs Crypto market cap excluding ETH and BTC
Ratio of ETH vs BTC also bouncing at key multi-month levels.
Weekly Chart: Ratio of ETH vs BTC

Focus Setups
Below are some setups I am watching, particularly seeing confluence in the cybersecurity space.
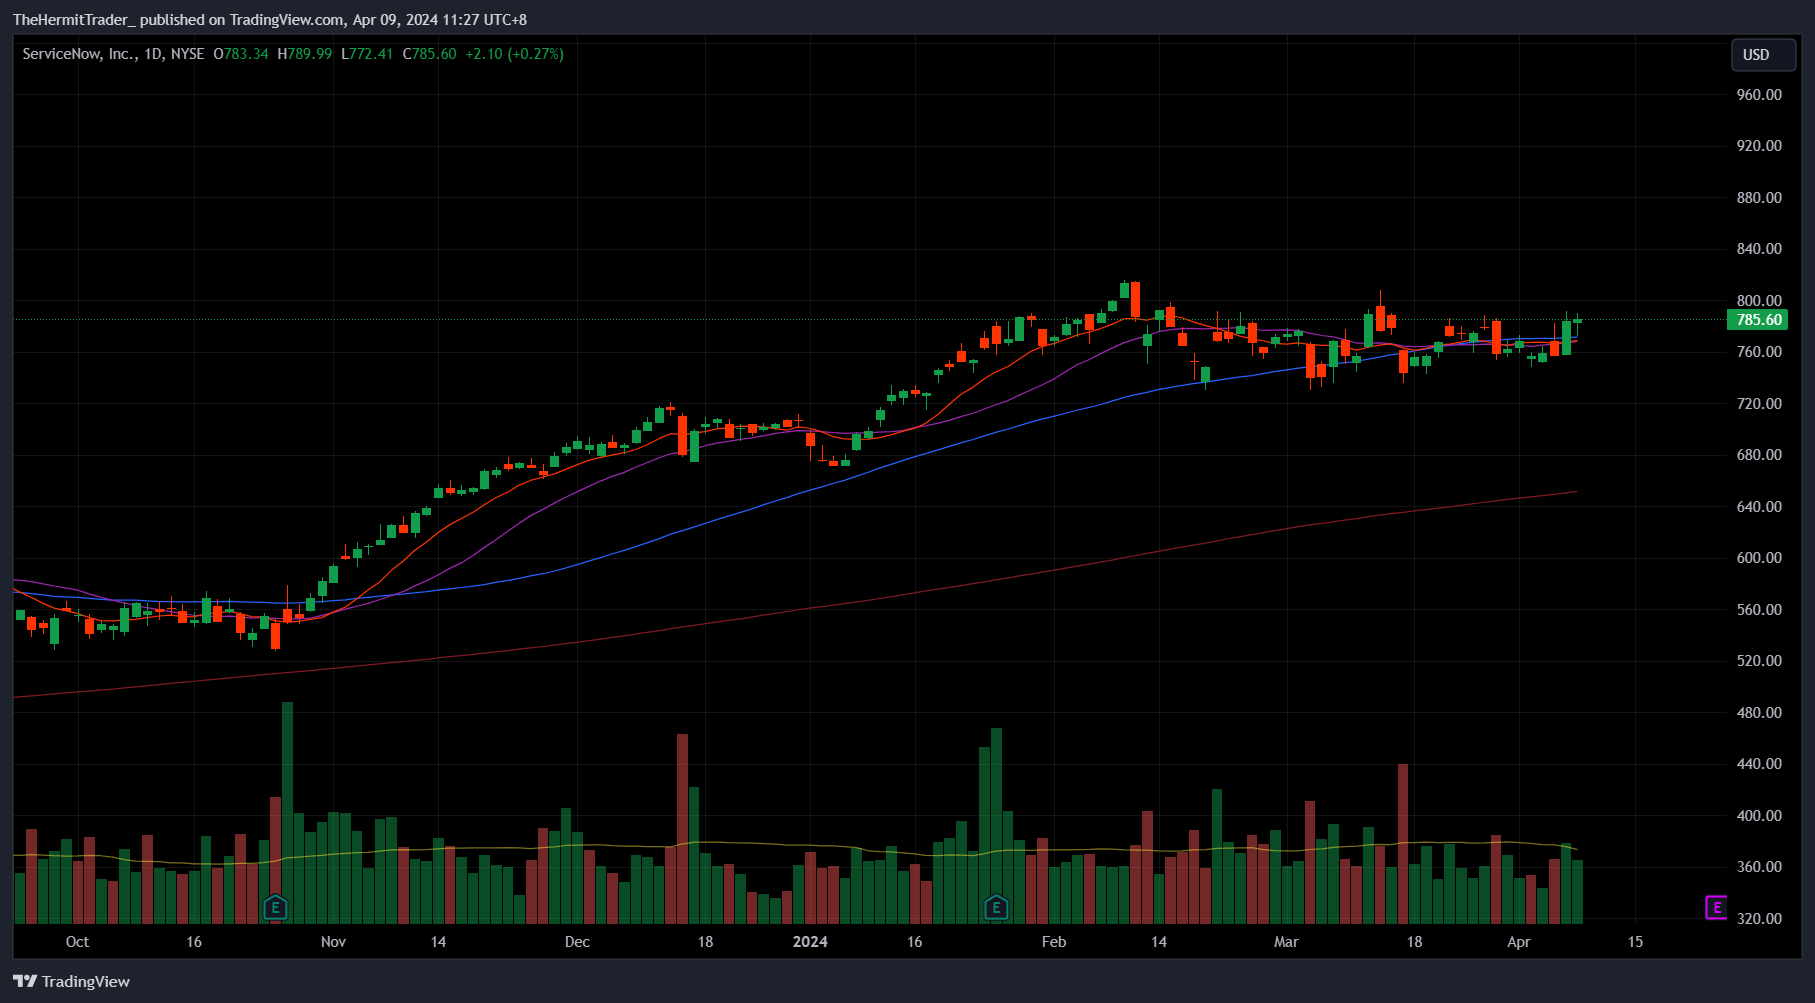
NOW - inside day candle, pretty smooth uptrend. Slow-moving, large cap stock which is a bit gappy, but will monitor how it trades.
Daily Chart: NOW
Moving on to cybersecurity names:
Keep reading with a 7-day free trial
Subscribe to TheHermitTrader’s Substack to keep reading this post and get 7 days of free access to the full post archives.