


Semicons & Wall Of Worry

Positive follow through in US indices after Monday’s reversal. Do not want to get too carried away. Ideally want to see a higher low and for key MAs to flatten out.
There are a small number of long setups in US stocks (mainly reversal plays), which I will share below.
EQUITY INDICES
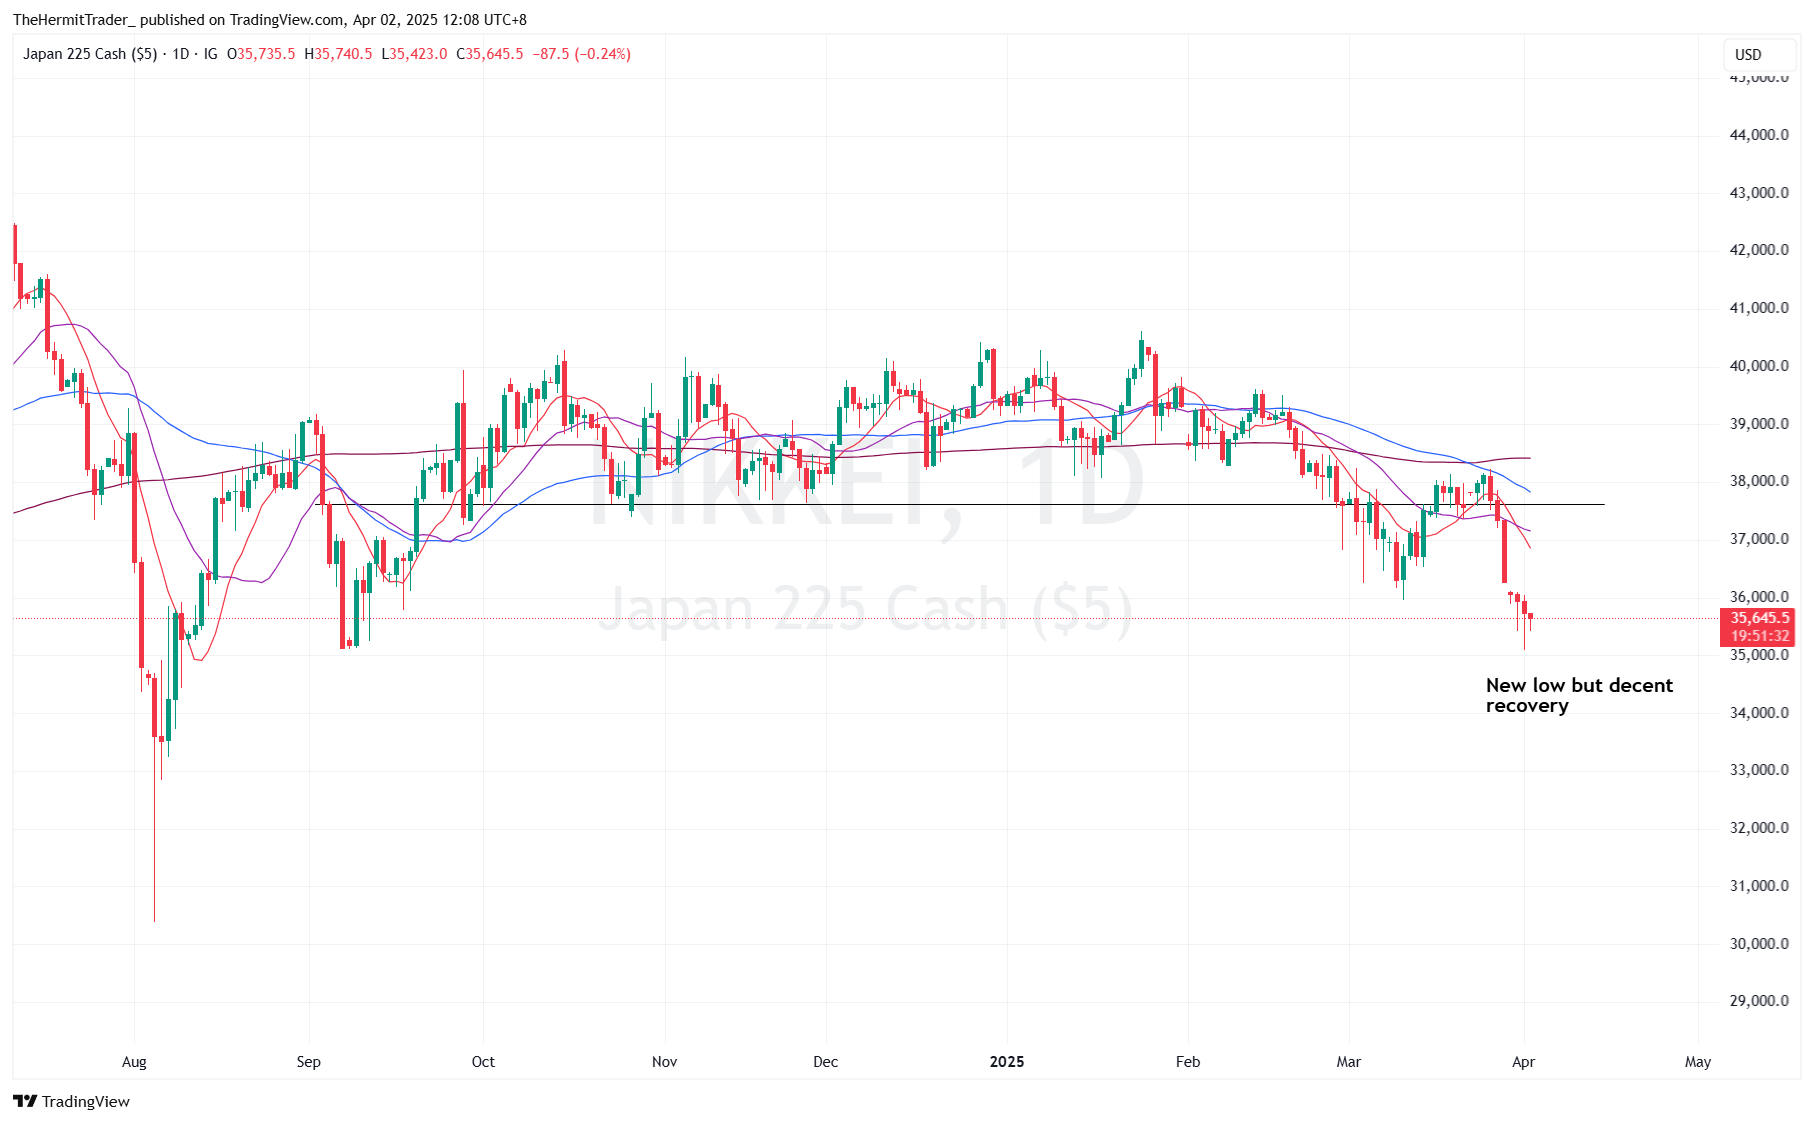
Nikkei 225 - new low on Tuesday, but decent recovery, building a long tailed reversal candle.
DAILY CHART: NIKKEI 225
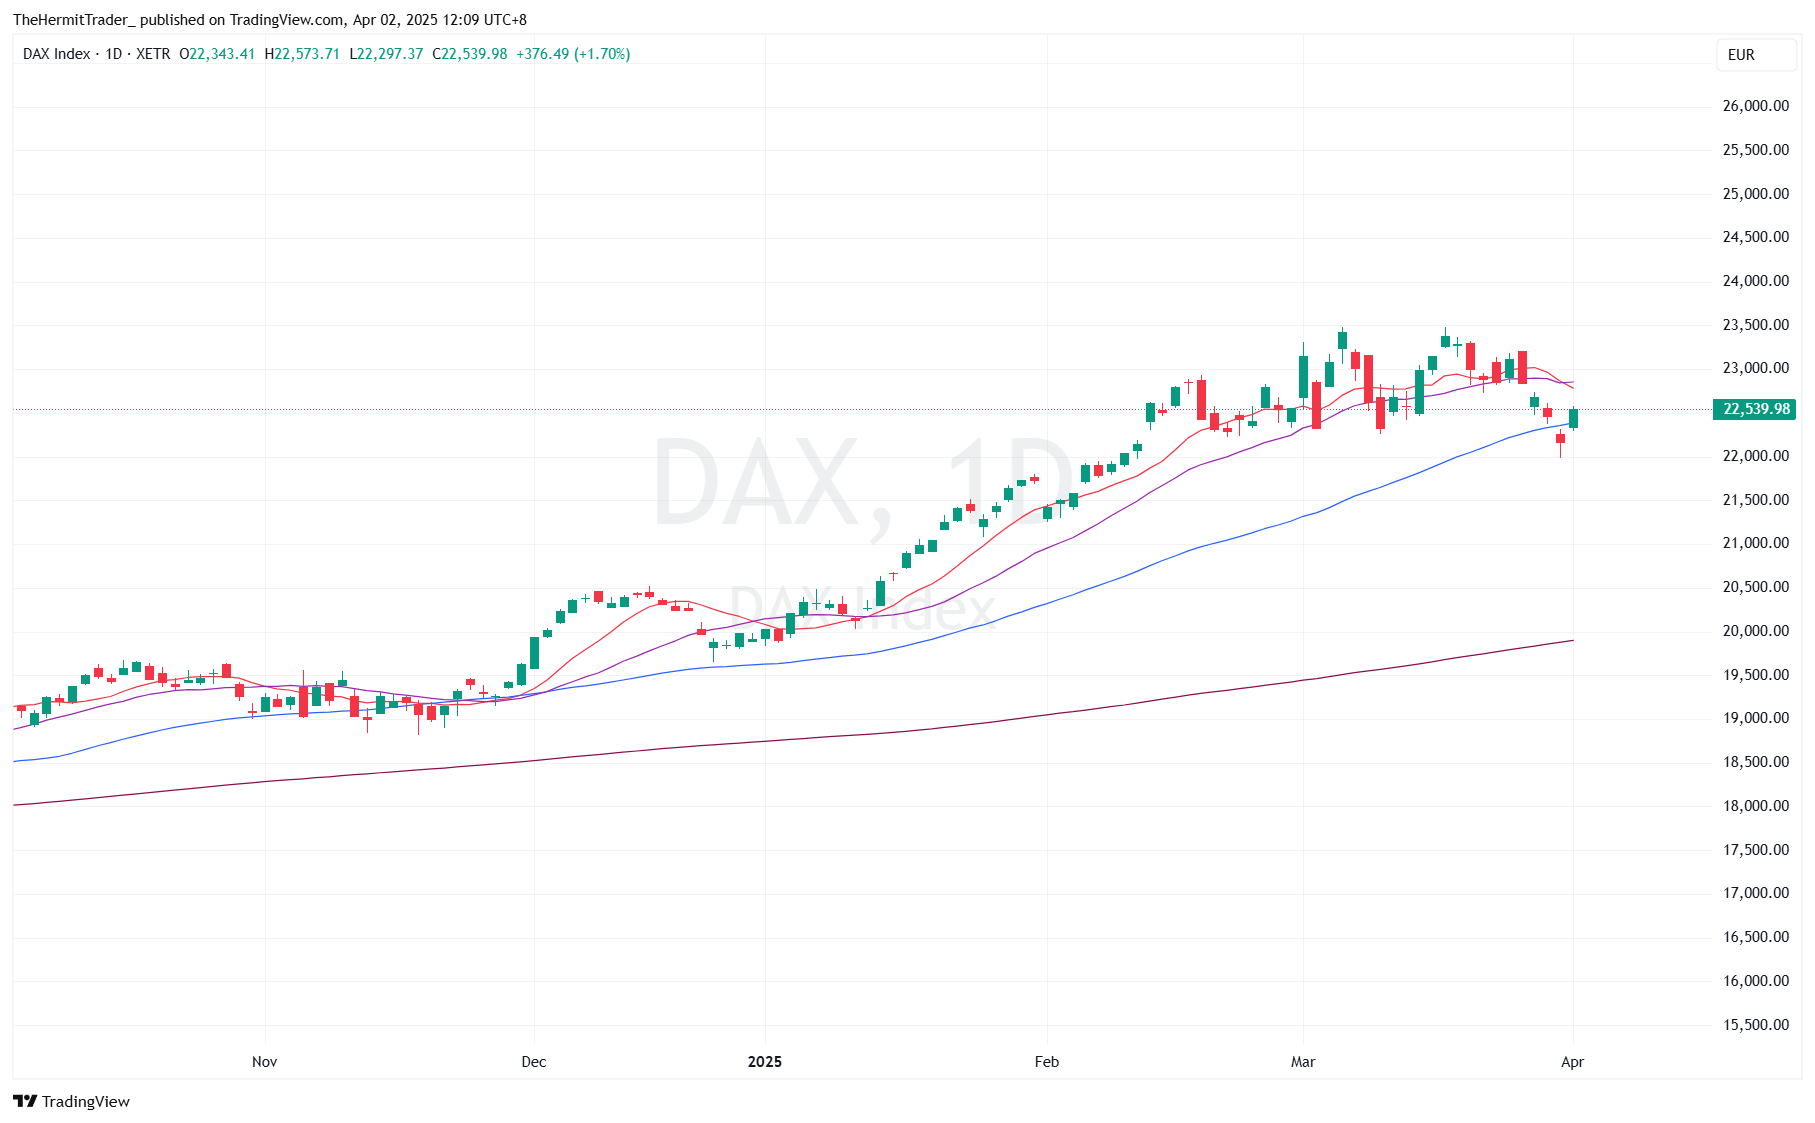
German DAX - strongest of the European indices. Bounced at the 50 day MA.
DAILY CHART: GERMAN DAX
CSI 1000 Index - proxy for broad China A-share market. Holding firm at minor support (swing low in March). Starting to surf the 50 day MA after Monday’s reversal candle. Potential early long entry within a larger scale 6 month range. I initiated a long position, with stop just below Monday’s low.
DAILY CHART: CSI 1000 INDEX

QQQ - new low on declining volume, as mentioned in yesterday’s post. Potentially means near term exhaustion in sellers. Ideally, want to see a higher low.
DAILY CHART: QQQ

META - at 28 month uptrend support. Could help support QQQ if we see it hold here.
2 DAY CHART: META

SEMICONS & WALL OF WORRY
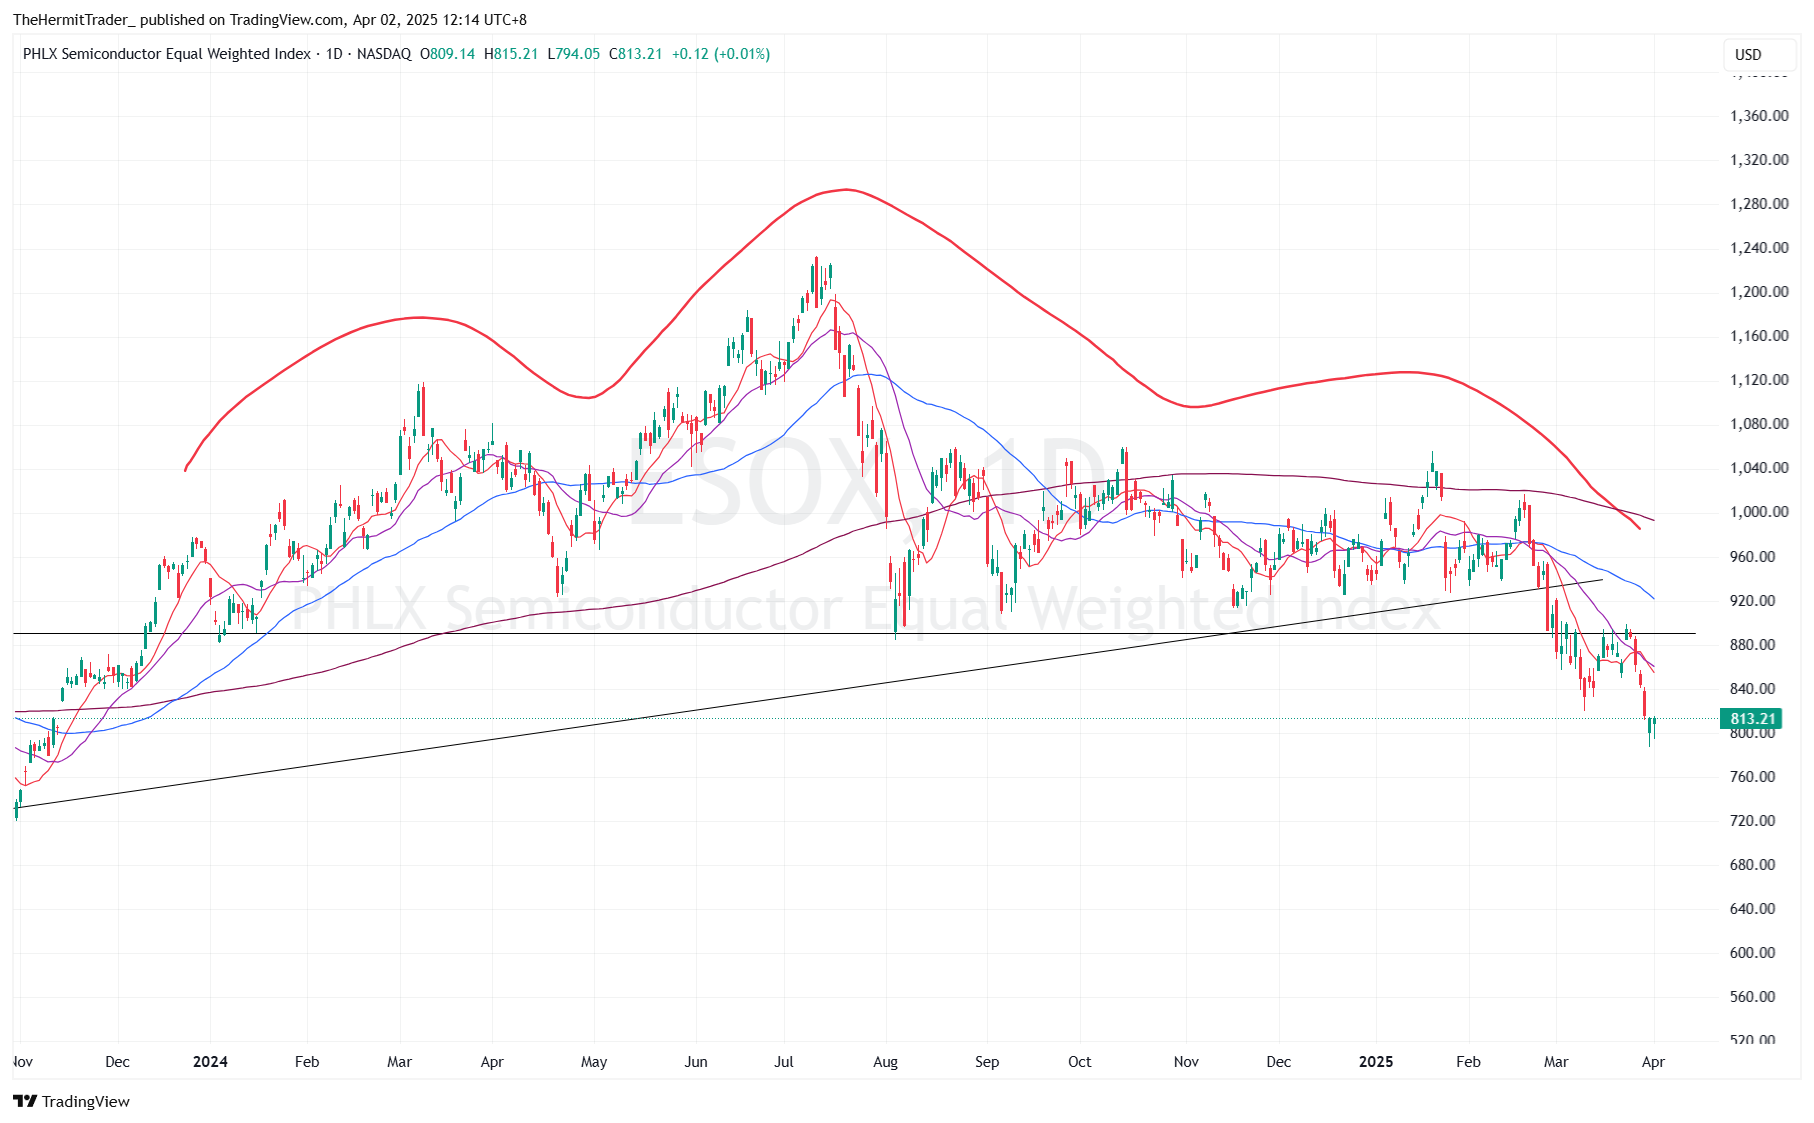
Equal weight semis - left for dead on recession fears, sentiment souring in AI/semis space, classic head and shoulders pattern on chart. But now we see an inside day candle following Monday’s reversal candle. Could see a 5-7% rally from here. Has potential to climb the wall of worry to surprise the market and retest the neckline, but one step at a time.
DAILY CHART: ESOX
NVDA - inside day candle.
DAILY CHART: NVDA

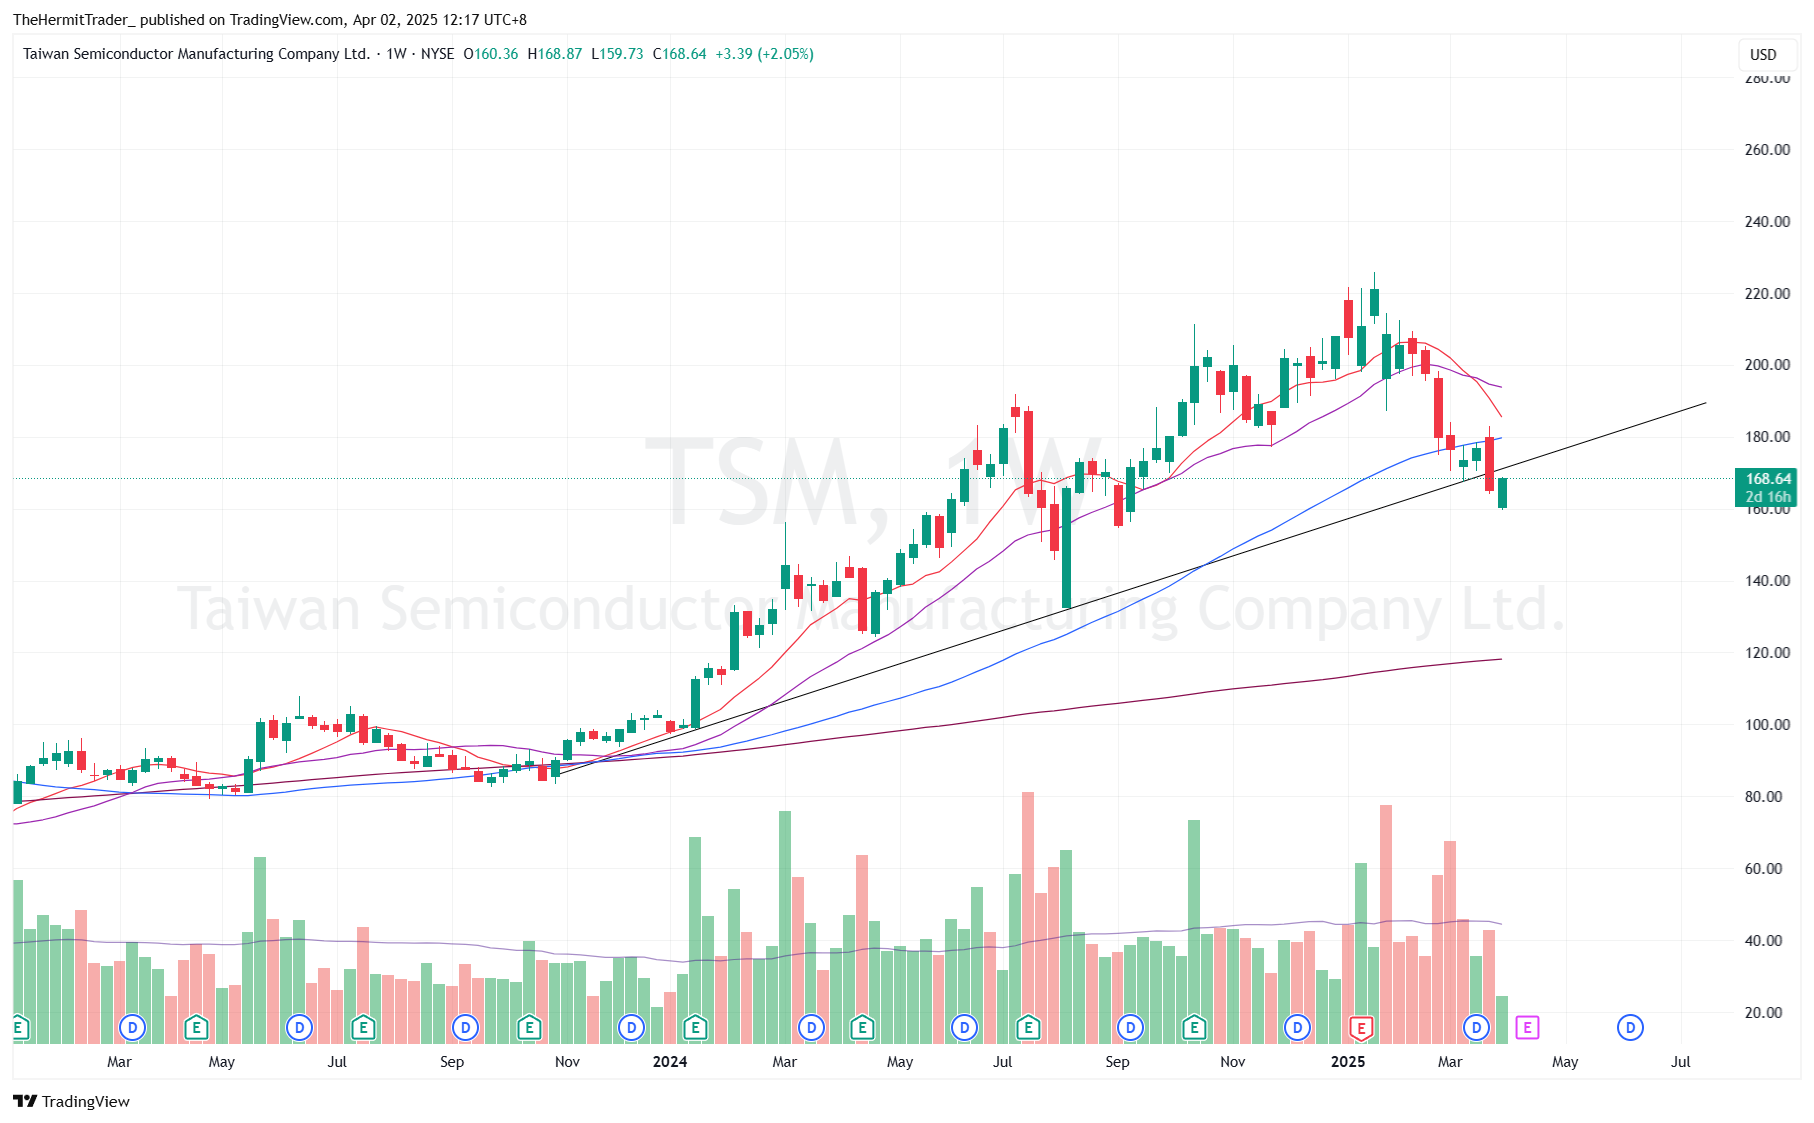
TSM - fell as much as -30% from peak to weekly uptrend support.
WEEKLY CHART: TSM
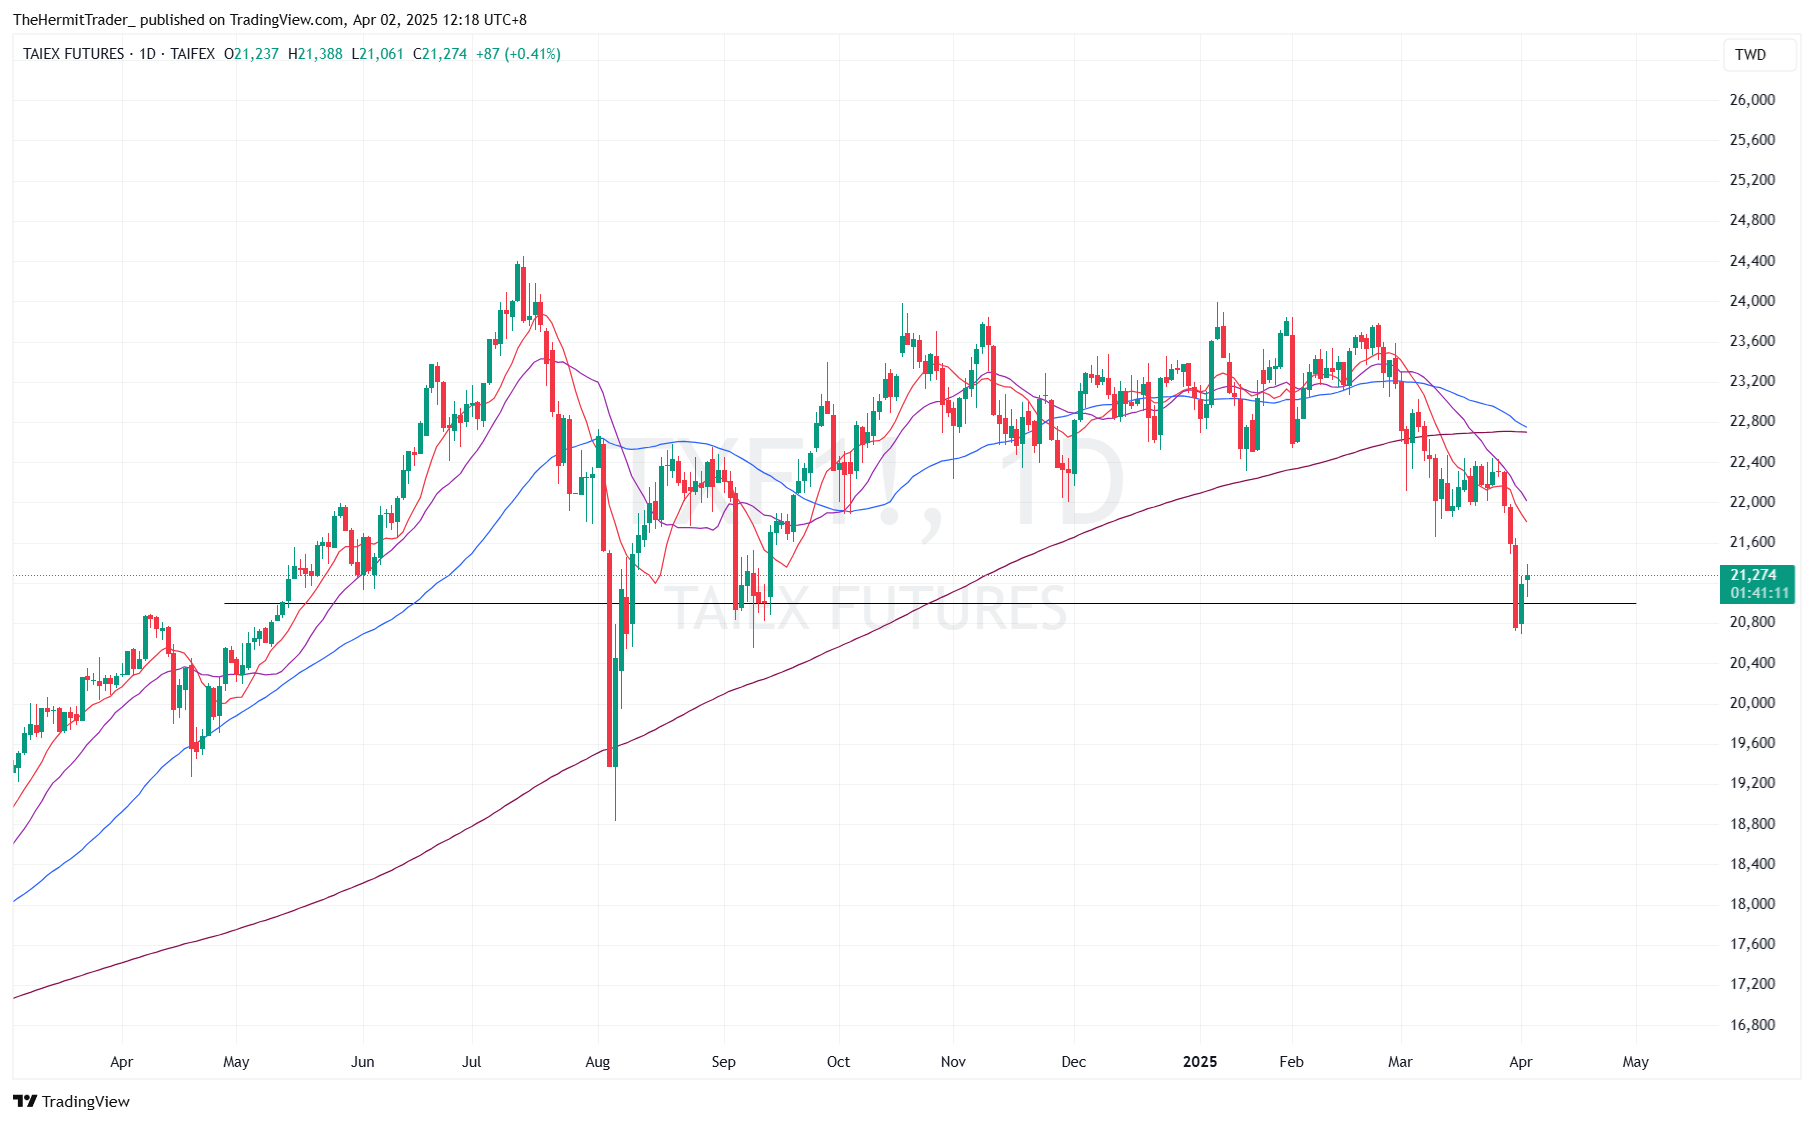
TAIEX - does it cave here or hold? TSM weight accounts for 30-35%.
DAILY CHART: TAIEX
SOXL - reversal setup with minimal risk (below Monday’s low)
DAILY CHART: SOXL

SETUPS
Out from base courtesy of earnings. Overhead head and shoulders looms ominously. Could see 15-23% pop to 50 day MA (7.30) or neckline (7.90)
DAILY CHART: RCAT

CVNA - took out prior lows in Jan, and then recovered, potentially flushing out longs. Now flagging while surfing rising 10 day MA. Could lead the rally.
DAILY CHART: CVNA

MSTR - busted wedge pattern?
DAILY CHART: MSTR

GBPUSD - trading tight.
DAILY CHART: GBPUSD
