


Thought process behind live positions: ICVX, MEDP, TITN
...and focus setups for today, 11 January

Hello everyone,
Below, I will go through my focus setups for Wednesday, as well as my thought process for some of my live positions.

Situational Awareness
Stocks pushed higher by the close of Tuesday's session, with Powell not touching too much on interest rates during his speech earlier in the day. The markets now await the US CPI number, to be released on Thursday.
The S&P 500 (SPY) is now trading above its 10, 20, and 50 day moving averages (red, purple and blue lines), and I want to see if price can hold above these averages.
As I wrote in my weekend post, there is potential for the SPY to test its overhead downward sloping resistance. This is around the $397-400 level, which is close to where the 200-day moving average is (brown line).
Daily Chart: SPY

These are the focus setups for Wednesday:
Focus Setups
Biotech stock Vaxcyte (PCVX) jumped on high volume in October on positive results on its experimental pneumonia jab. As I wrote in “Key technical setup I look for in trading", upside momentum can develop as a result of a company-specific catalyst, and this is certainly one example.
Since the strong run up, PCVX went on to consolidate in an increasingly tight range while surfing the 10 and 20 day moving averages (red and purple lines). The $46.50-$47 level is the pivot, and I have set an alert there, looking for a continuation of the move higher.
Daily Chart: PCVX

Biotech stock RAIN Industries (RAIN) appears to be carving out a multi-year base on the weekly chart. In recent months, RAIN has been consolidating in a wedge pattern.
Weekly Chart: RAIN

Drilling down to the daily chart, RAIN has been tightening up above the moving averages, and put in an inside-day bar on Tuesday. $179 looks like a clear pivot, and I have set an alert there.
Daily Chart: RAIN

In the next section, I will share my thought process on my live positions.
All live trade executions are communicated over the paid subscriber chat. Do remember to download the App, and turn on notifications.
Live Positions
Icosavax (ICVX)
Biotech stock ICVX is another example of a stock which developed strong upside momentum as a result from a specific company-related catalyst - in this case, upbeat data for its vaccine jab, released in mid-December.
ICVX shot up higher before consolidating in an increasingly tight range. On 5 January, ICVX put in a narrow-range bar, which suggests the stock has pent-up energy. When ICVX took out the high of the narrow range bar on 6 January, I took a long position. This was an early entry, as the breakout pivot was at $8.45. I spread out my stop losses - 1/2 position at the 5 January low, and 1/2 position at breakout day's (6 January) low.
Daily Chart: ICVX
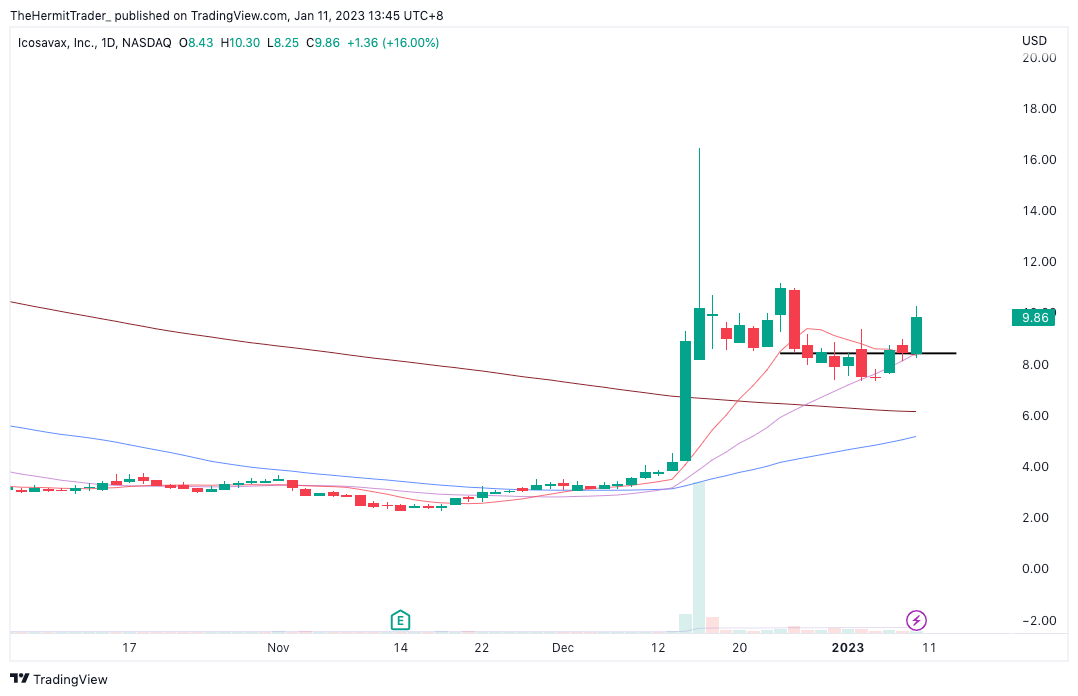
The stock went from strength to strength, breaking the $8.45 pivot on 6 January, and then closing +16% higher yesterday. I have sold 1/2 of the position on strength, and am keeping the remaining 1/2, which is up 3x reward to risk.
I was able to place tight stop losses on this trade, and hence when the trade took off, it had a positive and swift impact on my reward to risk metric. Once again, explained here: "Key technical setup I look for in trading”.
Now that I have a buffer, I am able to move my stop higher to $8.25 to lock in profits. $8.25 is the low of yesterday's full-bodied candle, and is a reasonable level to exit the position if price reverses to reach there.
Medpace Holdings (MEDP)
Medtech stock MEDP broke out from a nice range yesterday, and I went long as price crossed the $217 pivot. Once again, this stock developed strong upside momentum after beating earnings on 25 October. Our job is to harness this momentum, by first waiting for the stock to consolidate and set up.
When the stock took off yesterday, my stop loss was placed just below the breakout day's low. The rationale for the stop loss is that if price returns back to the day's low, the breakout has most likely failed, and I want to be out.
Daily Chart: MEDP

Titan Machinery (TITN)
Industrial stock TITN gapped up on earnings on 30 November. See the similarity with ICVX and MEDP? Now that the stock has developed strong upside momentum, we want to harness this.
When TITN tightened up and crossed the pivot on 6 January, I took up a long position, with stop at the day's low. The rationale for the stop loss is that if price returns back to the day's low, the breakout has most likely failed, and I want to be out.
This allows me to set a relatively tight stop loss, and hence I am controlling my absolute $ risk while being able to put on a larger position size. Once again, explained here: "Key technical setup I look for in trading”.
Daily Chart: TITN

Manchester (MANU)
MANU was a long trade I was stopped out of. The stock has some serious momentum, and has spent the past few weeks consolidating in a tight range. I went long as it broke out on 9 January, but price reversed and stopped me out. I am still maintaining an alert at the $23.30 pivot. Sometimes, stocks set up again after a failed breakout, which improves the long setup.
Daily Chart: MANU

Overall, as my positions have moved in my favour, I am open to adding on more exposure if the opportunities arise.