

US CPI; Focus Setups: 10 Apr

Hello everyone,
Chop and volatility
Quite a great deal of volatility and chop going into US CPI today.
I wrote recently that cryptos and China were the leading sectors. The former chopped around while the latter was more constructive, with indices pushing above major downtrend resistance during Wednesday’s Asia session.
I was stopped out on my crypto positions in ETH, BTC and some altcoins - most of them at cost. I was eager to protect capital by raising my stops to cost quickly once the trade is up +1R, but am ruing not taking larger partial profits on strength.
So with my positions largely cleared out, I am rebuilding again. Same strategy to quickly raise stops to cost if a trade goes +1R, and to only entertain the sectors that are leading the broad market.
One constructive development was the late-session rallies in US indices. But ultimately there is a dearth of solid setups in the market.
With many major altcoins trading close to 30% below their 52 week highs, I am biased towards the long side here. I took up a new long position in SOL on Tuesday.
Cryptos
Solana - testing March lows. RSI on daily chart is close to a YTD low, and has hit oversold levels on lower time frames. I placed a stop loss at 159.50.
Daily Chart: SOL

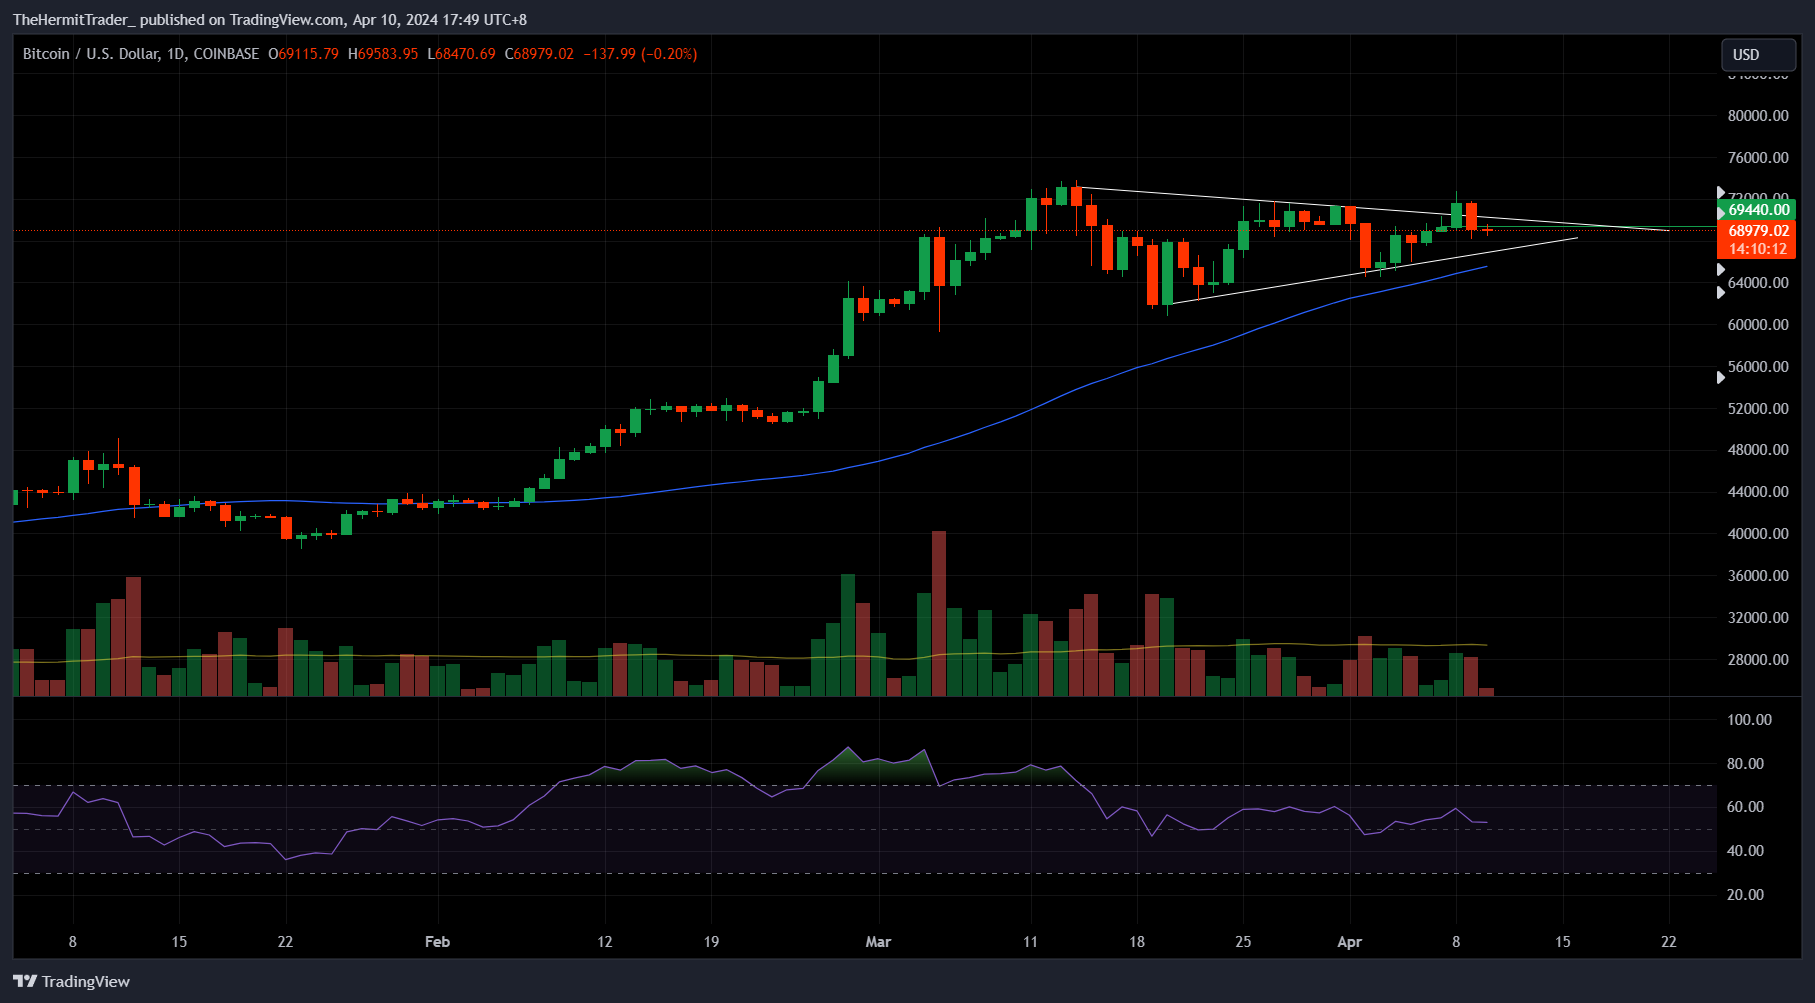
Bitcoin - broke out from wedge pattern briefly, and then pulled back in. Bitcoin halving, which is viewed as a constructive event, is slated to occur in mid-April. I prefer to position long for a rally going into this event, and will be wary of “sell the news” price action after the event.
Daily Chart: BTC
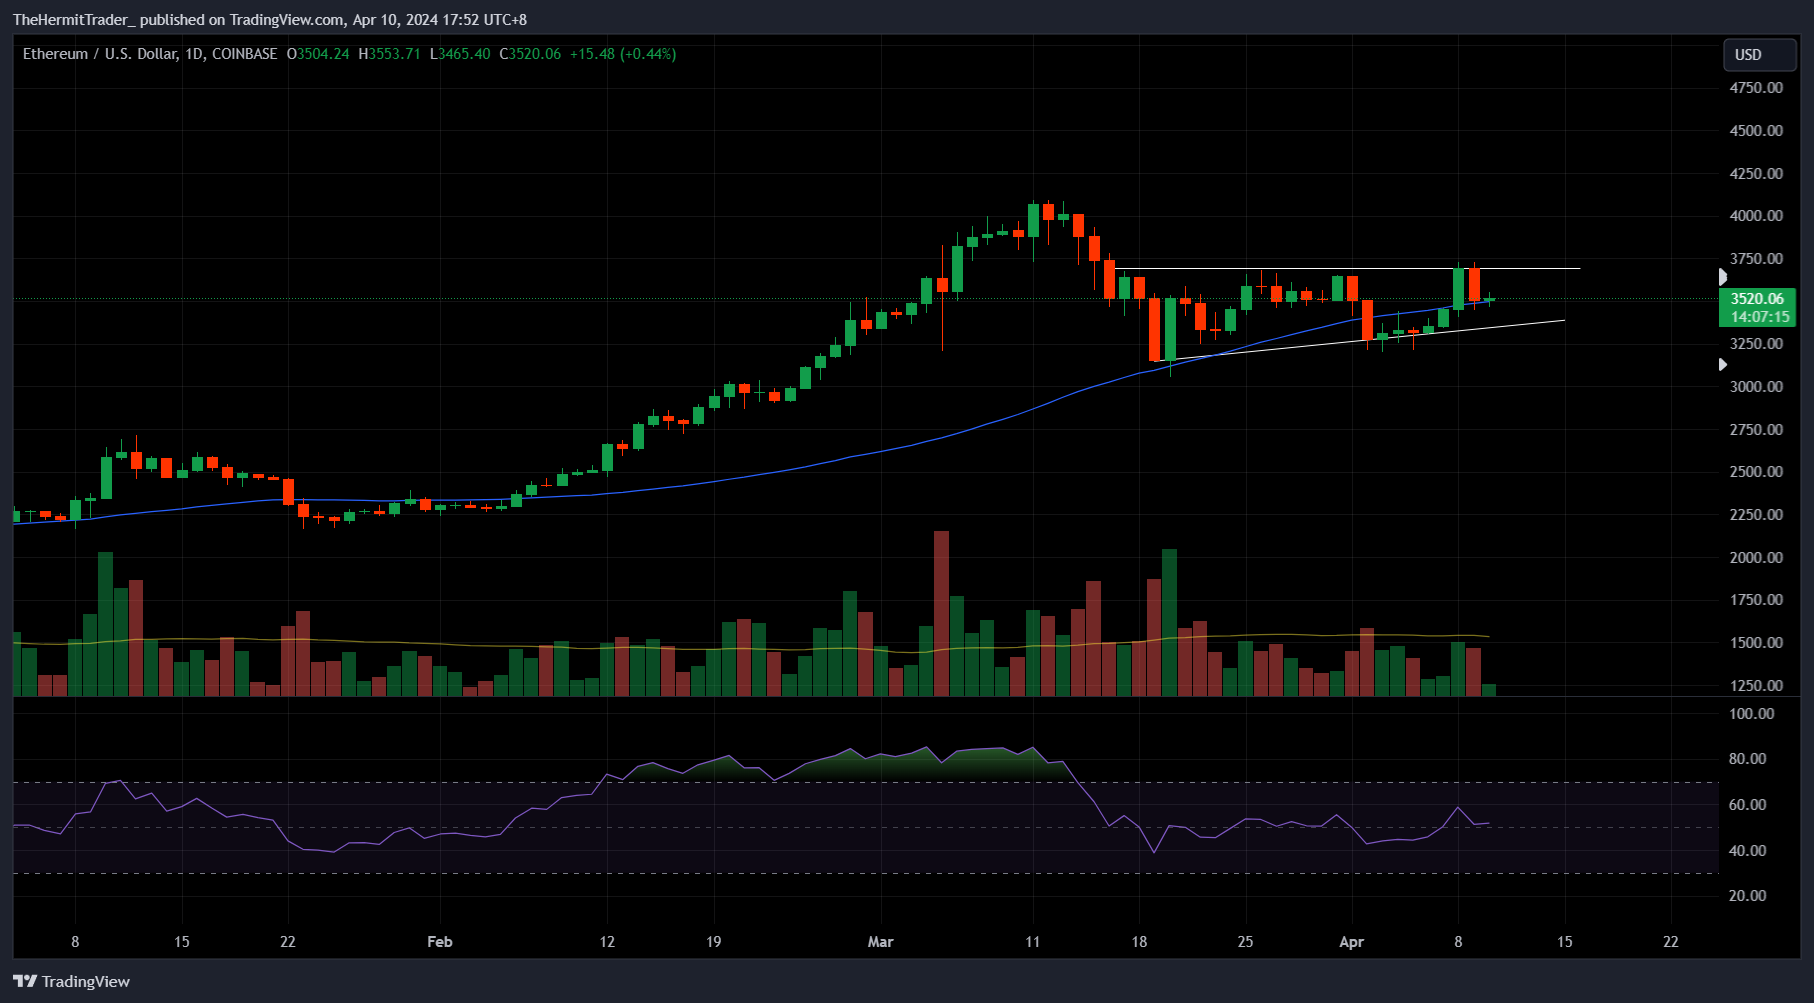
Ethereum - pretty much rangebound for a month.
Daily Chart: ETH
China
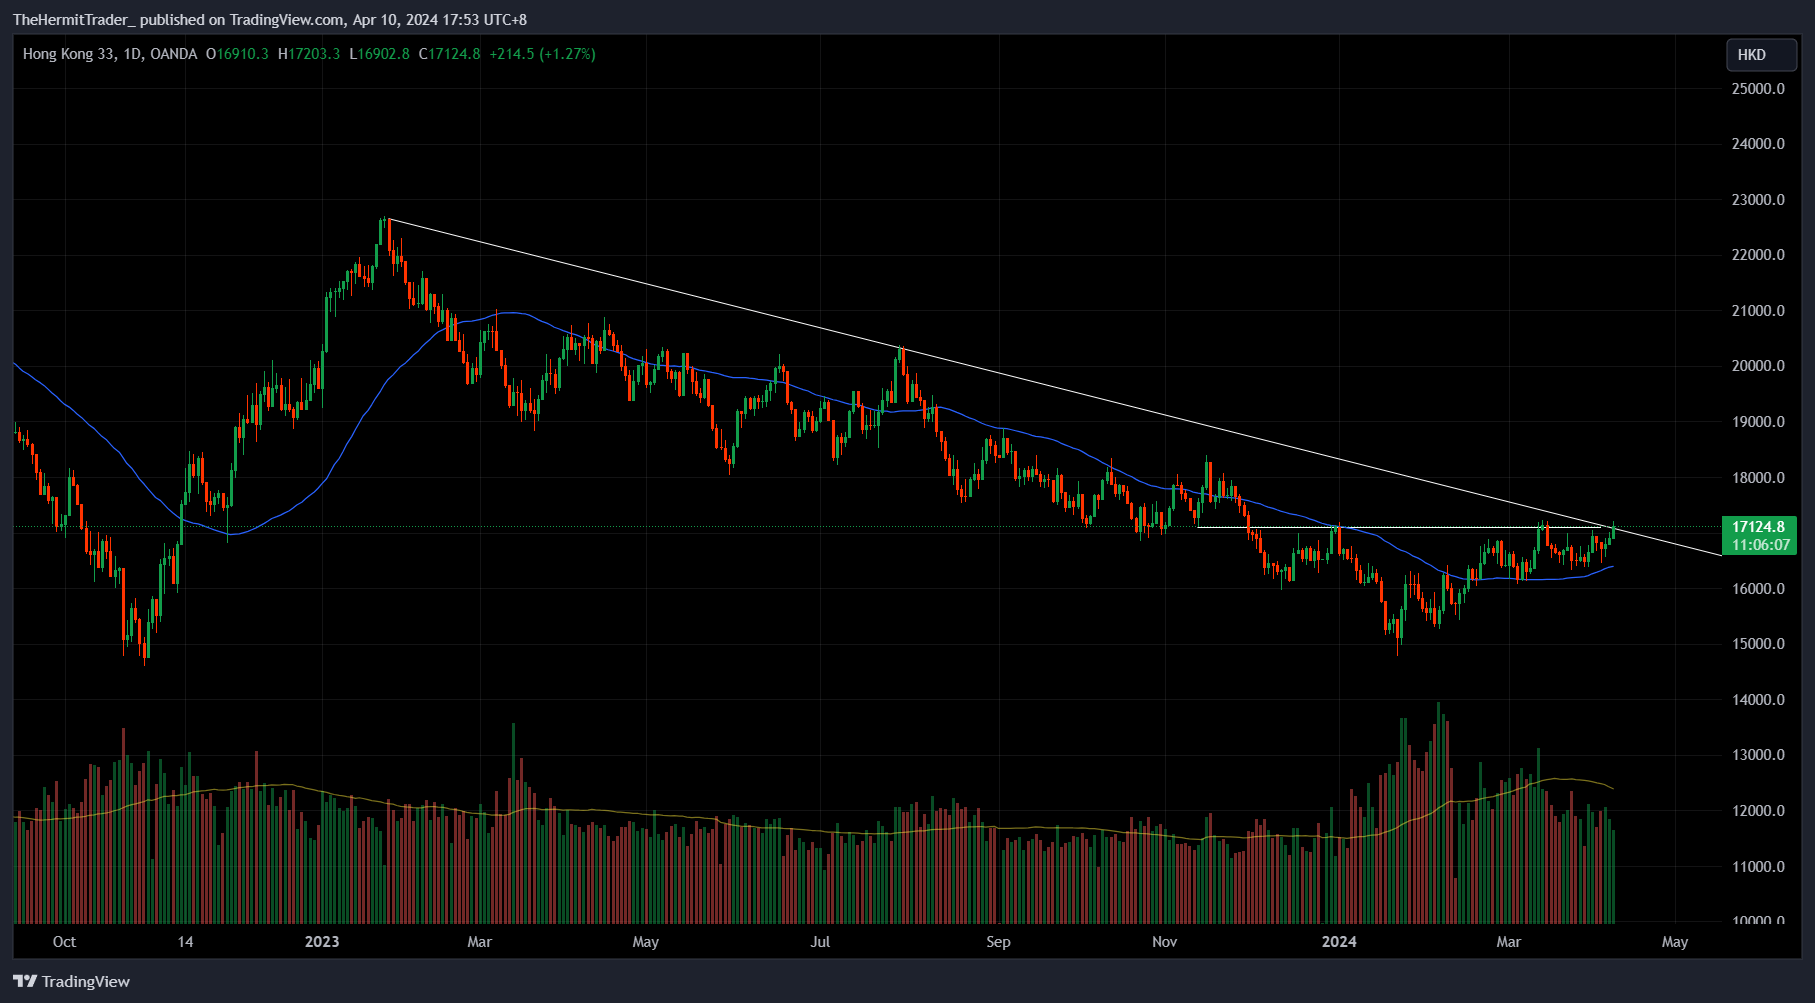
HK stocks at critical level, right at downtrend resistance + structural resistance. I am long China H-shares index futures.
Daily Chart: HK33
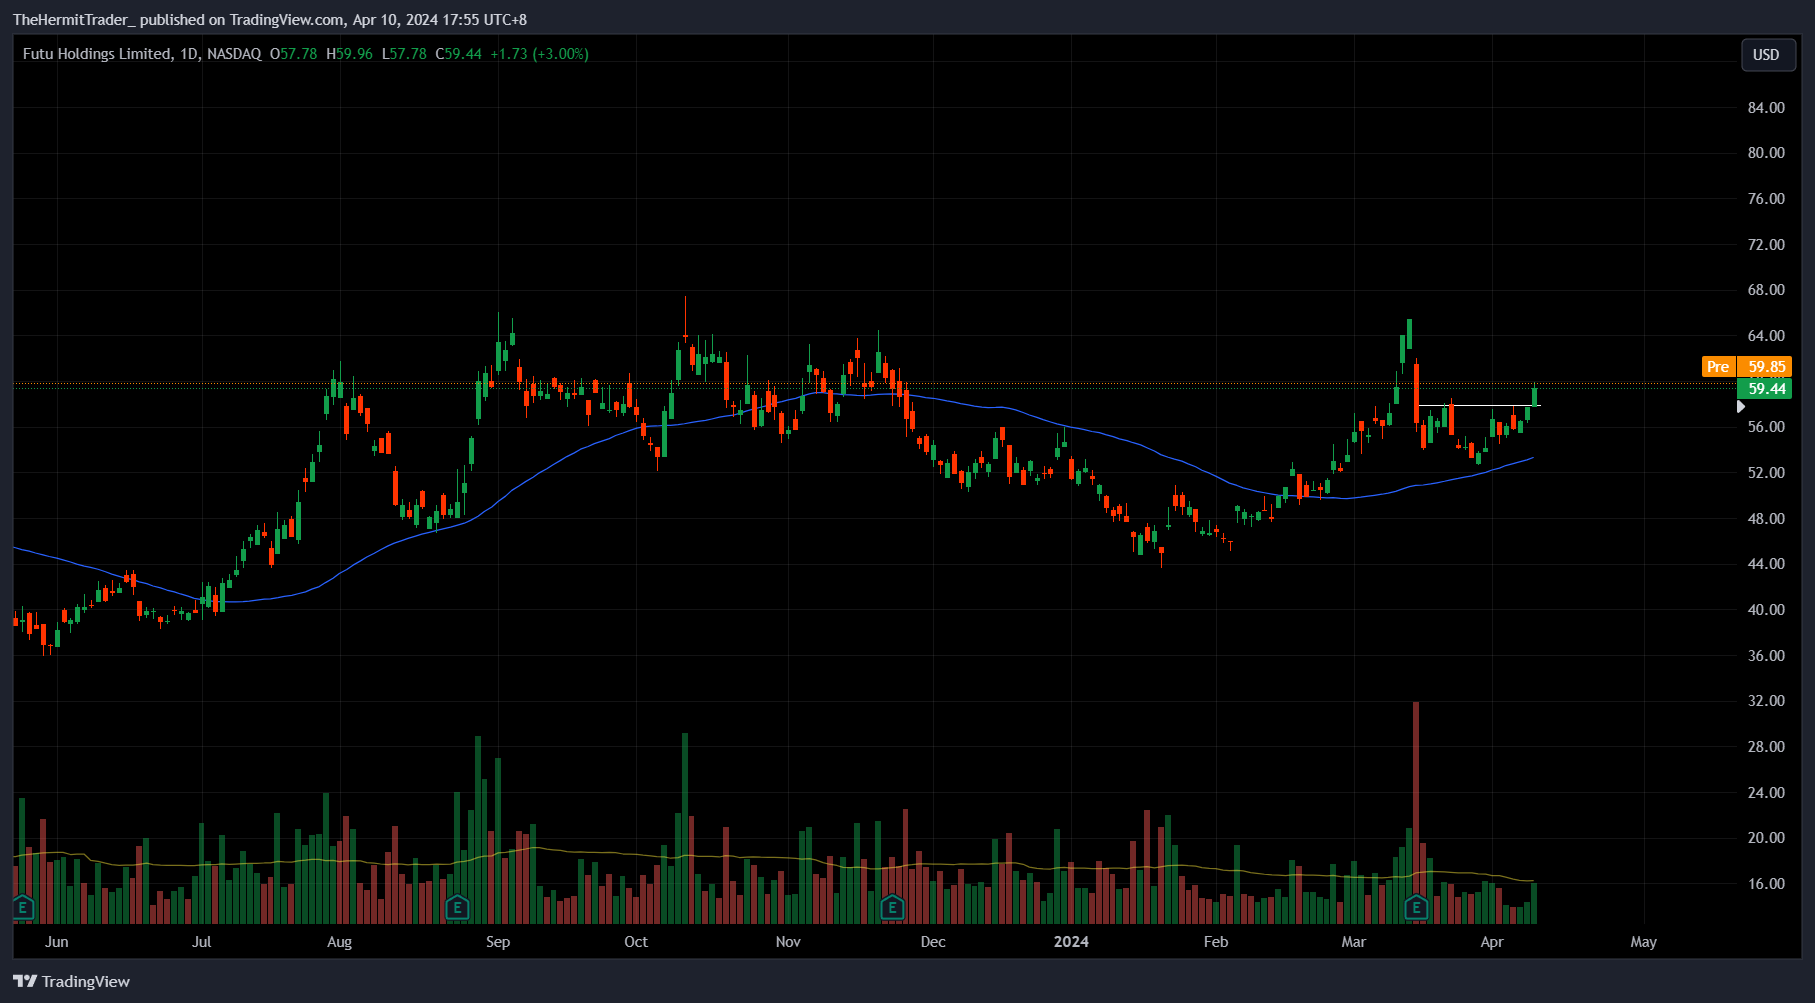
FUTU - on focus list yesterday. Broke out nicely. Should have chosen this over JMIA for my long, given China was the strong in-theme sector.
Daily Chart: FUTU
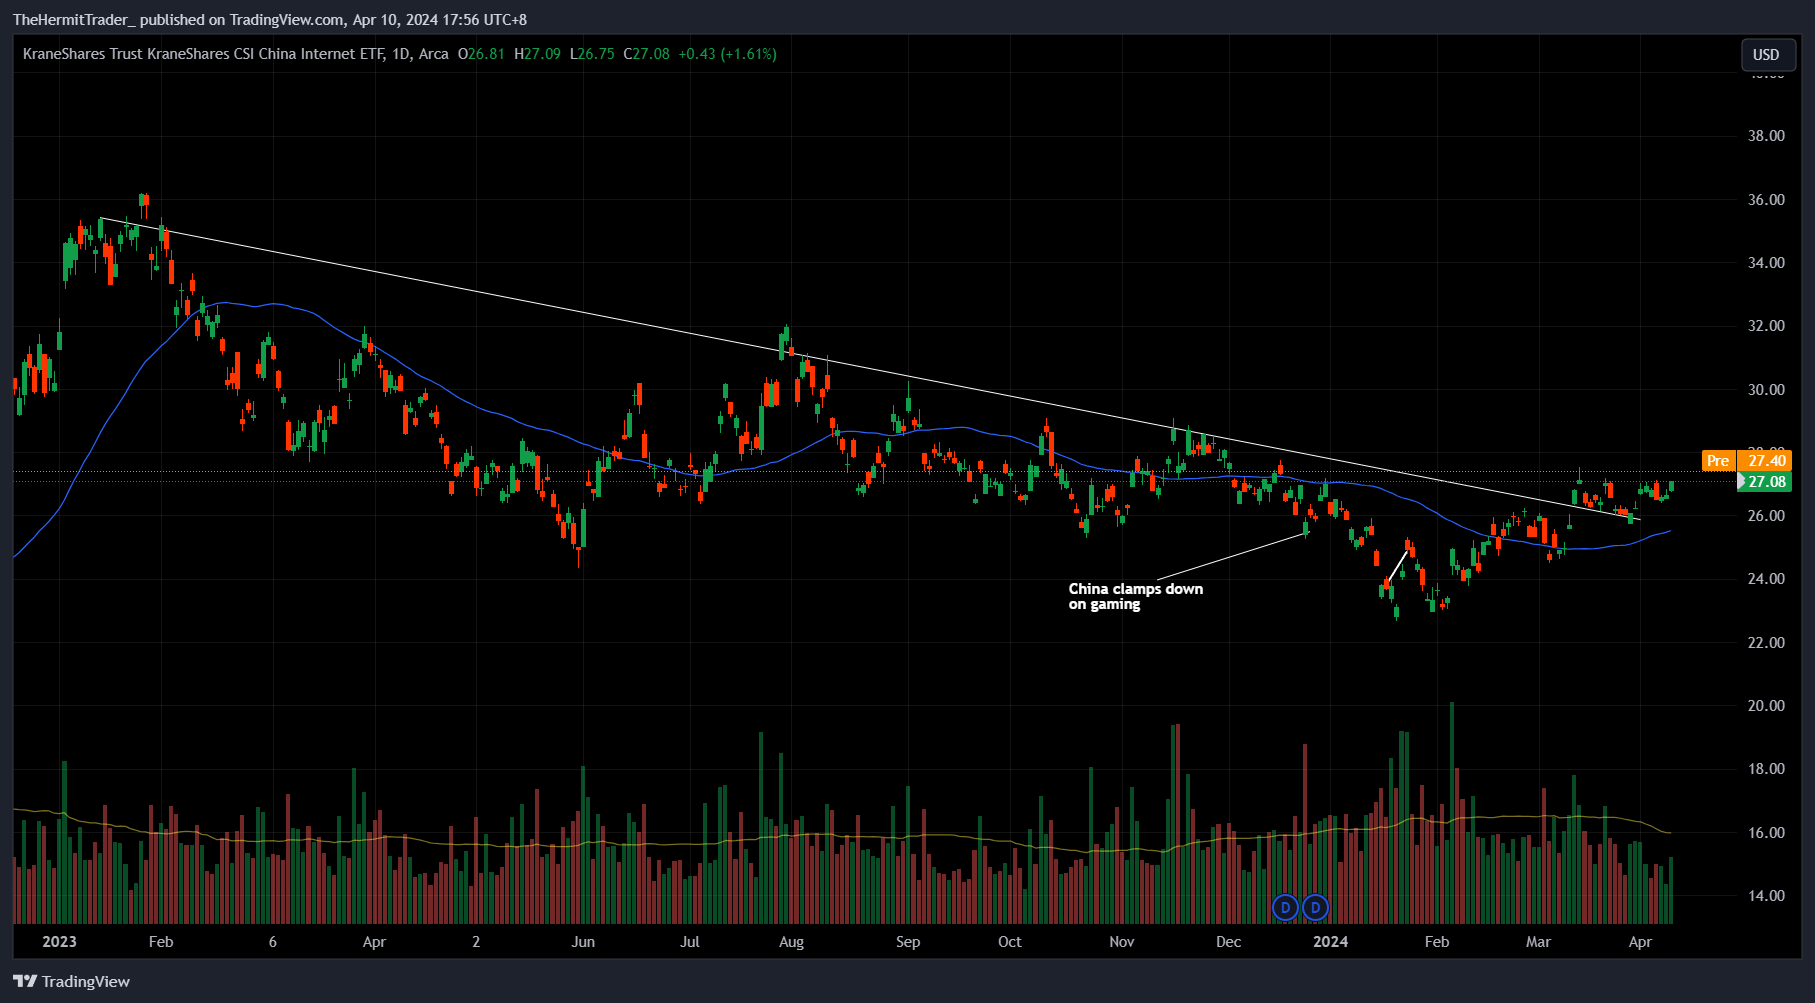
KWEB - China tech stocks broke out above downtrend resistance back in March. Now likely to push out of mini consolidative base which has been building since the breakout.
Daily Chart: KWEB
US indices
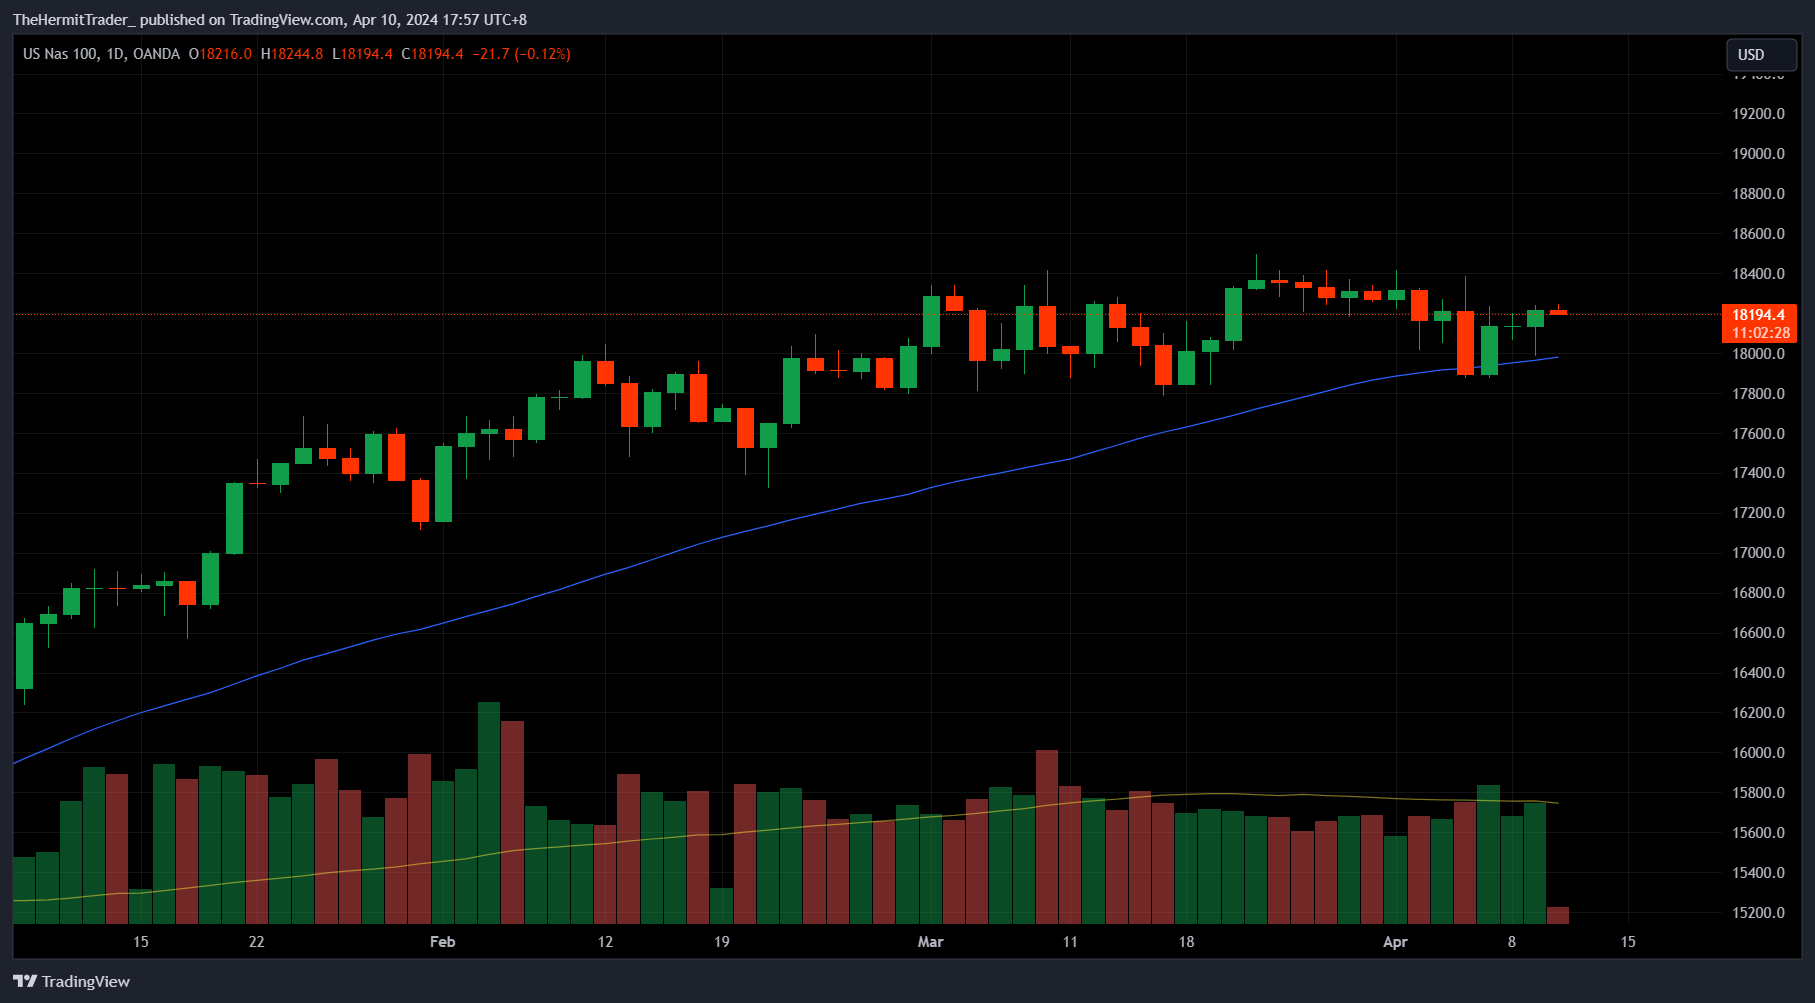
Nasdaq 100 - bounced off 50 day MA. Long tailed reversal candle on Tuesday. This bounce took place in the last hour of Tuesday’s session. Bullish price action typically happens when indices open weak but close strong.
Daily Chart: Nasdaq 100 Futures
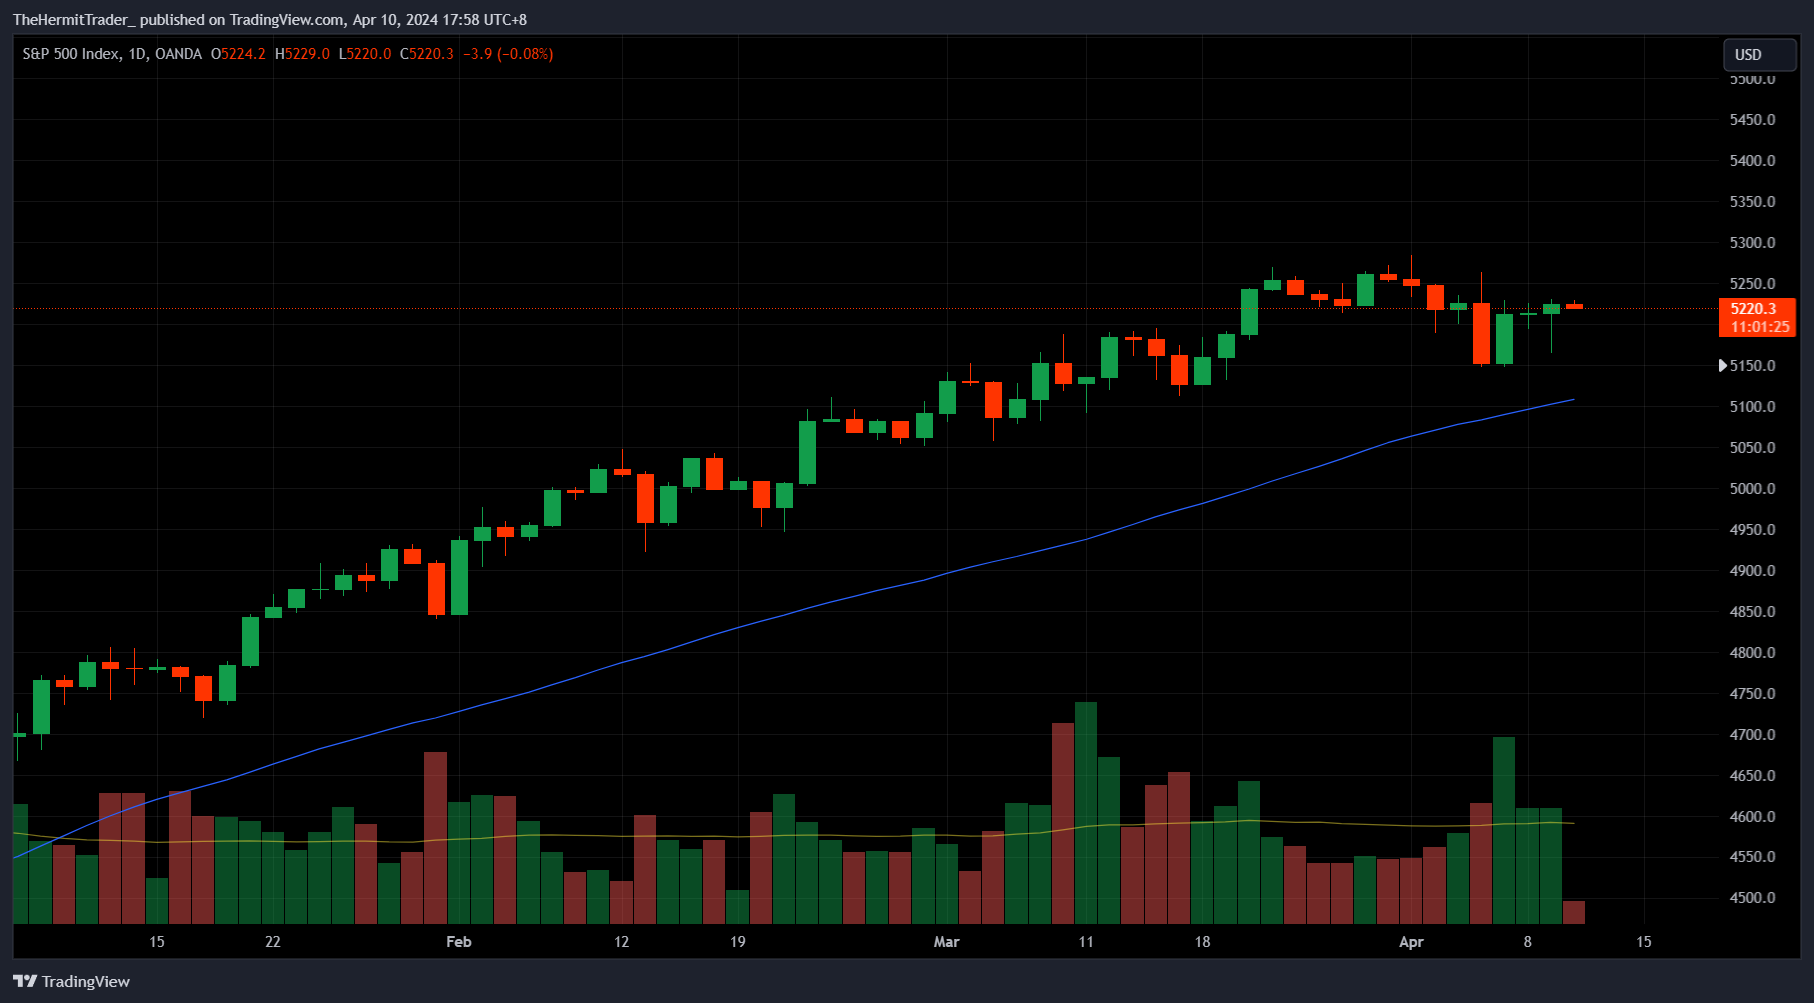
S&P 500 - Same development for S&P 500.
Daily Chart: S&P 500 Futures
Focus Setups
Any stock that spends as little time as possible erasing last Thursday’s sharp selloff is considered a leader, and there are a small handful.
Keep reading with a 7-day free trial
Subscribe to TheHermitTrader’s Substack to keep reading this post and get 7 days of free access to the full post archives.